Gartner®️ Market Guide for DEX Tools
Enhance the Digital Employee Experience (DEX) in Modern Workplaces

Global Digital Employee Experience Survey
1,800 leaders share views on generational expectations, hybrid work, IT’s evolving role, and obstacles and strategies for Digital Employee Experience (DEX)
Intelligent Service Desk
Aternity can fix a broad spectrum of recurring issues, prevent incidents, employ optimal resolutions, and reduce user frustration

WHY YOU NEED US
Maximize Visibility and Performance
Overcome the challenges of insufficient visibility, unpredictable network and application performance, and expanded cyber security risks—all while improving your ability to be agile and resilient.
Unified Observability
Deliver flawless digital experiences to customers and employees
IT Asset Cost Reduction
Reduce costs for devices, software, cloud and network
Cloud Visibility and Performance
Reduce the risks and costs of migrating apps to the cloud
Network and App Acceleration
Fast, seamless, secure app delivery for distributed enterprise

WHAT WE DO
Modernize IT for Digital and Cloud Success
To take advantage of digital and cloud technologies that fuel transformation, organizations must modernize their IT infrastructure.
But this doesn’t happen overnight. Whatever the pace, Riverbed can help IT teams make the transition in the most performant, cost-effective, and secure way.
Riverbed Solutions
Full-fidelity, No Sampling

Digital Experience Management
Network Performance Management
Application Performance Monitoring
Infrastructure Monitoring
Acceleration Solutions
Hybrid, Cloud, On-prem
Cloud Acceleration
SaaS Acceleration
Remote Work Acceleration
WAN Acceleration
Our Customers' Stories
Empowering the Digital Experience of Thousands of Organizations Worldwide
Worldwide, Industry-Wide Success Stories
At Riverbed, we pride ourselves on meeting and exceeding the relentless expectations for organizations worldwide, across every industry. Our Customer Voices’ highlights real results achieved by real businesses just like yours.

Our Customer Voices
How Riverbed is driving transformation across every industry
ADDITIONAL RESOURCES
What’s New at Riverbed

Power of Riverbed Aternity’s Intelligent Service Desk
A game-changer designed to propel your IT Service Desk in to new world
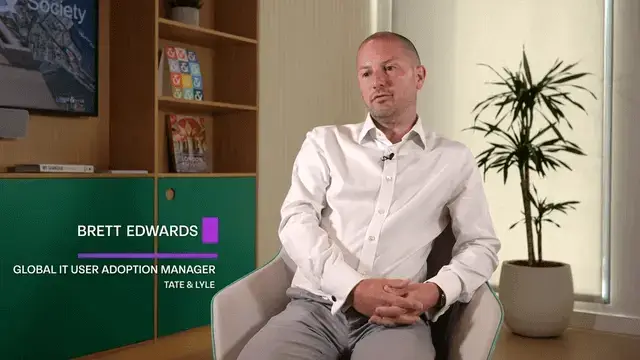
Tate & Lyle
FTSE 250 global supplier of food and beverage ingredients reduces software costs and improves network visibility

Retention of Millennial and Gen Z Employees Rests Heavily on DEX
CIOs Now Becoming Chief Talent Officers Too