Custom Data Collection & Enhanced Monitoring for IT Service Teams
- By Amalia Rodriguez
- 17-Mar-2023
The principle of IT Service Management is to enable better Service Delivery by focusing on how IT teams can manage the end-to-end delivery of IT services to not only their users, but their customers as well. While Riverbed Aternity can support IT teams in meeting their goals by providing out of the box real-time visibility and actionable insights to help helping troubleshoot and improve user experience and the level of service, some customers require a digital experience management solution that is easy to use, configure and customize.
Customization becomes relevant when the IT teams need specific performance analysis based on data that Aternity is not currently monitoring out-of-the-box. This is also true when the Service Desk team needs to avoid connecting remotely to a device to verify data such as current configurations, installed software, services in use and system details. Riverbed Aternity addresses this need by providing a mechanism to customize and automate data collection and the dashboards based on stakeholder needs.
One example of the need to customize these metrics came from a large German industrial company. The organization needed to create dozens of custom PowerShell, WMI and event log monitors to collect custom data based on their IT teams’ requirements. They used the custom monitoring to provide the IT daily business with enhanced and extended visibility, allowing deeper analysis and more informed decision making aligned with their organization’s goals.
Support the daily business of the Service Desk
To support the daily need of the Service Desk team, Riverbed Professional Services initially used the Out-Of-the-Box (OOB) Riverbed Aternity dashboards, which were found to be an excellent starting point. This enabled the team to investigate problems with malfunctioning devices that employees in the organization were complaining about. The dashboard summaries, where the main and most important device metrics were visible, helped the support engineers with initial troubleshooting without having to connect to devices remotely. This saved time and accelerated their troubleshooting. Without the need to ask a number of questions for a support issue or browsing to the remote device, the Service Desk teams could quickly see device CPU speed and type, memory size, the model, disk free space, corporate browser usage, and much more. However, there were times where the Service Desk team required additional knowledge on the properties of a device, location or user, which Aternity did not detect OOB.
Creating custom monitoring to collect custom data enables deeper troubleshooting and enterprise-wide analysis. This is because custom data can be used to more easily group together items that share a distinct property and monitor performance. Moreover, custom data can then be exposed in the Riverbed Aternity Rest APIs or in the OOB Analyze dashboards.
The German industrial sector company mentioned in the example earlier configured a custom monitor to report the device RAM channel mode, and then created a custom dashboard to compare the performance of Single vs Dual RAM channel mode. In their other use cases, the customer’s Service Desk goal was to proactively improve the digital end user experience by looking for specific configurations impacting users. As an example, the Service Desk team created a monitor that collected information about several services to decide if they were being used and if they could disable them via Group Policy.
The following list provides further examples of the custom monitors created by this company for the daily work of their Service Desk team:
- Get RAM Channel Mode
- Get WiFi drivers
- Check Autologon enabled
- Check usage of services: disable non used services by GPO policies
- Get Battery Wear check when more than 2 batteries in place
- Has Dbutil Installed
- License Recovery Dialog Shown
- MS Defender Version
- Network Access Users
- Network Discovery Monitor LDAP
- DMA Kernel Protection Status
- Get Aternity Browser Extension Version
- Get Batch Logon Users
- Get HVCI Status
- Get Open Firewall Rule
- Get Secure Boot Status
- Get Service Logon Users
- Get Reliability Grade /WMI
This enhanced visibility meant that the Service Desk team were more efficient without involving users with remote sessions, allowing them to compare different configurations based on performance/cost criteria. It also allowed them to implement proactive optimizations to improve the digital user experience.
Enhanced analysis and troubleshooting for better decision making
The Riverbed Aternity UI allowed the IT Service Desk teams to see the most valuable information for their daily business. This enabled them to create custom-data based dashboards to expose and analyze data as required for informed decision making.
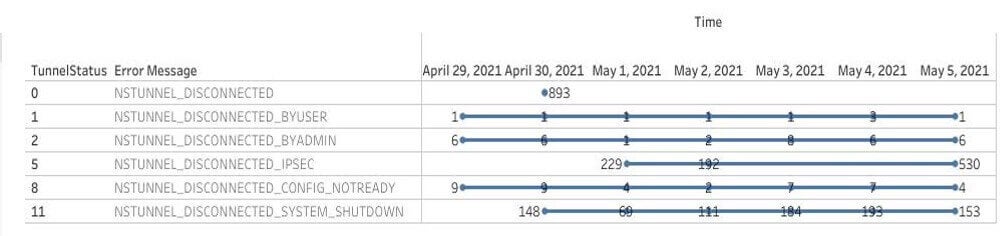
Using this methodology, the customer created several custom monitors in Aternity for the security team. Using these monitors, the team was able to automatically and proactively detect potential security issues related to wrong proxy client configurations, unsigned drivers and available security features. In the Aternity Dashboard shown below you can see the Netskope configurations derived from custom data collection:
As shown above, Riverbed Aternity provides a flexible and easy to use mechanism to collect custom data based on the IT Service teams’ actual needs and to enhance and extend Riverbed Aternity’s Out Of the Box real-time visibility and actionable insights. This allows enhanced monitoring, which in turn increases team efficiency, enables collaboration, saves time, reduces costs, maximizes uptimes, and provides informed decision making aligned with organizational goals.