Riverbed at Networking Field Day 26: Demonstrating End-to-End Visibility from the Client to the Cloud
- By Riverbed Technology
- 30-Sep-2021
Riverbed has presented at Networking Field Day a bunch of times, but for the most recent event, we took a different approach than usual. We wanted to show a real example of how Riverbed’s solution provides both deep and wide visibility from the client to the cloud.
Rather than present 100 PowerPoint slides, we walked through troubleshooting an actual application performance problem. We still had a slide here and there to introduce the tool we’d use in that segment, but other than that we wanted our presentation to be as much demo as possible.
We built an environment of real client computers running over a real SD-WAN to real web servers in three AWS regions. We connected everything to our SQL backend, and we stood up internal and external computers running internal and public DNS. And to set the stage for our presentation, we purposefully caused poor application performance of our demo web application.
Level 1 helpdesk
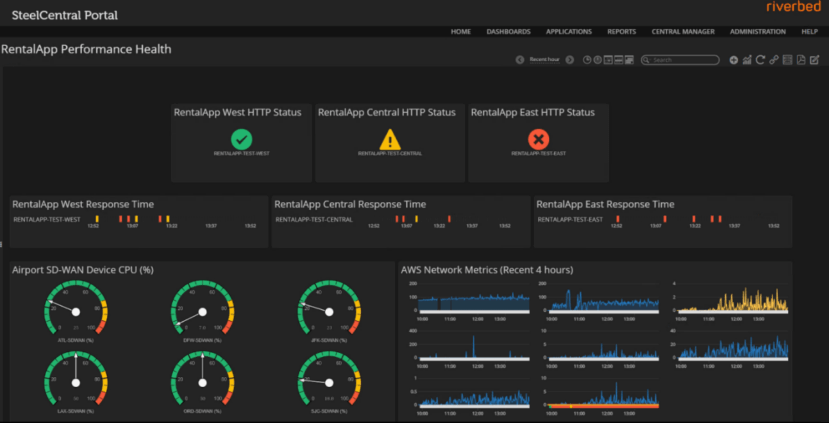
I started with Portal, similar to how a level 1 helpdesk person would. We immediately saw a problem with our AWS East region and no indications that there was a problem with our SD-WAN. So, just like in an actual troubleshooting workflow, I escalated the ticket to the next engineer.
Visibility from the client perspective
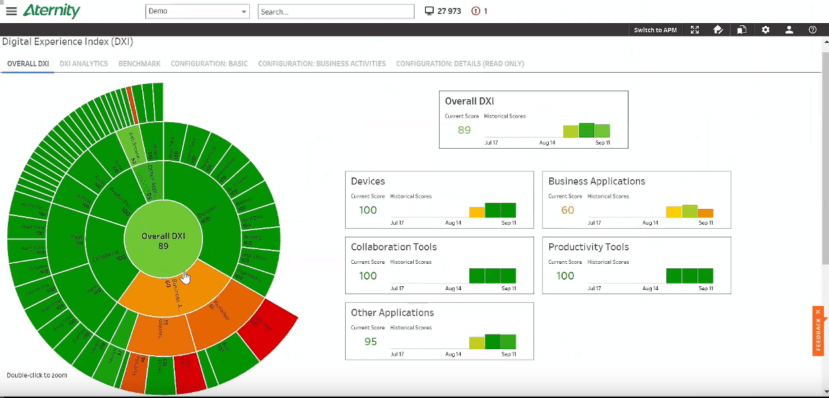
Jon Hodgson, VP of Product Marketing at Aternity, analyzed the client-side with Aternity. Aternity uses agents installed locally on endpoints, whether those be workstations, mobile devices, servers, or even containers. Jon used the Aternity dashboard and DXI, or the Digital Experience Index, to confirm poor application performance on all computers, but he also discovered an unauthorized crypto miner on three machines.
Investigating a security breach
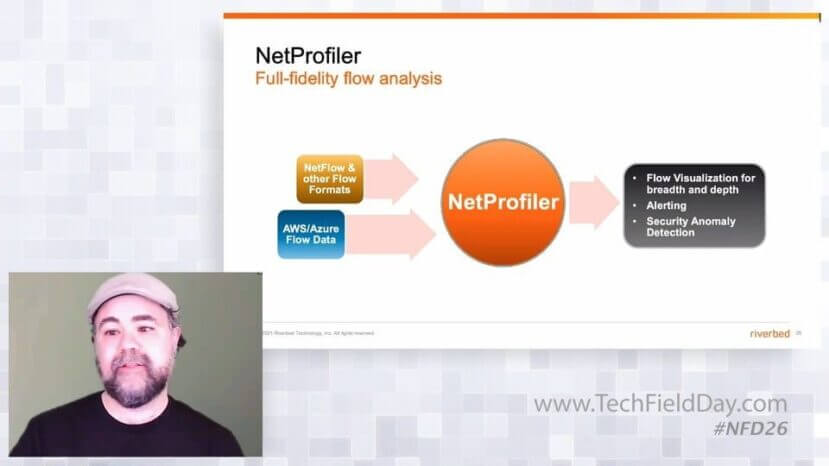
This was a security breach, so it was time to escalate to John Murphy, Technical Director at Riverbed, who played the role of a security engineer. John used NetProfiler to dig into the crypto miner application flows to determine where they were going, when they started, and what else on our network was infected. We believe that visibility is the foundation for robust network security, so to us it’s only natural to incorporate automated security investigation functions into our flow analyzer.
Though John got some great info in terms of the breach, he didn’t find the root cause of our application performance problem. So he escalated the ticket to the network team to see if there was a problem with the network itself.
Escalating to the network team
Brandon Carroll, Director of Technical Evangelists, used NetIM to look at the path in between clients and AWS. SD-WAN gateways looked healthy, core switches looked fine, and all our regions showed green in the dashboard. It was time to get more granular, so Brandon introduced Riverbed’s synthetic testing tool, built right into NetIM.
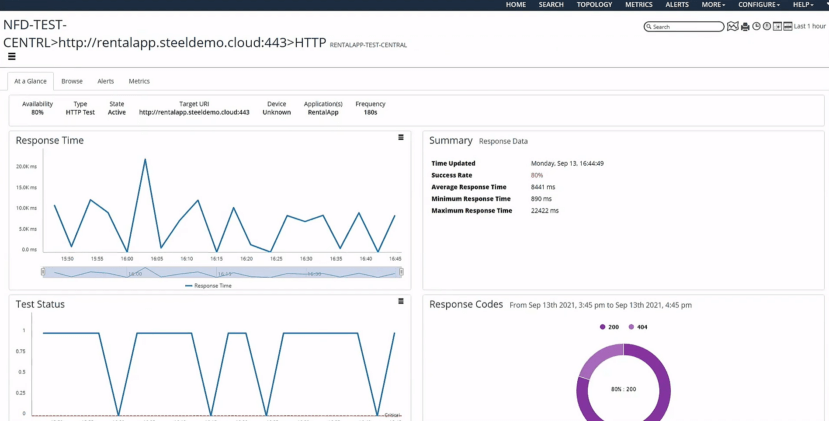
Several tests were already running – in this case, HTTP tests which monitored successes, failures, and response times to our web servers. The metrics didn’t look good. Response times were high, and success rates were around 80%. And using some synthetic monitoring tests he created on the fly, he began to see strange DNS issues.
With this red flag, Brandon escalated the ticket to our last engineer, Vince Berk, CTO at Riverbed. Vince used AppResponse to analyze the specific TCP connections between our clients, DNS servers, and web servers.
Digging deep to find the root cause
AppResponse is a powerful analytics tool. It gives us the macro view of how applications are doing using visualizations of server response time, retransmission delay, connection failure and setup time, and an entire host of metrics that can be looked at individually or taken together as the application’s User Response Time. And since AppResponse gathers every single packet we throw at it, it’s also a full-fidelity visibility tool down to the most granular micro level.
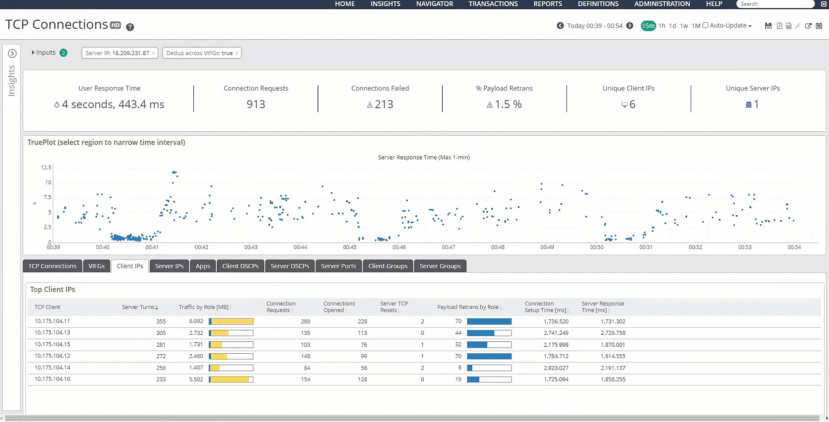
And that’s exactly how Vince used AppResponse. He analyzed TCP flows, looked at individual packets, and ultimately found that DNS wasn’t load-balancing but was instead pointing all requests to the AWS East region. All this unexpected traffic overwhelmed our AWS East web server which negatively affected the performance of our application.
Remember that Portal is our macro view and usually our first step in troubleshooting, so the helpdesk may have figured out the root cause right away.
You can visit our NFD26 presentation, to see each of our visibility tools used independently to analyze different pieces of the puzzle.
Riverbed’s end-to-end visibility solution operates at the macro level to provide high-level metrics of application performance, but when it’s time to roll up your sleeves and get into the weeds, our tools provide the depth and breadth of end-to-end visibility at the micro level from the client, through the network, and to the cloud.
Visit Tech Field Day’s event page to watch our entire presentation at Networking Field Day 26, and visit the Riverbed Community to join in on the discussion!