When working with SteelConnect EX an important concept to understand is that of a SD-WAN headend. You simply cannot operate a SteelConnect EX SD-WAN network without the headend. We covered the high-level overview of the headend in our Lightboard video and you can view it on the Riverbed YouTube Channel. However, for the sake of being thorough, let’s review what a SD-WAN headend is and the components involved.
Components of a Headend
There are three main components of a headend. These include:
- SteelConnect Analytics
- SteelConnect Director
- Controller
These three entities are responsible for the management and control plane of the SteelConnect EX solution.
SteelConnect EX Director (Director)
SteelConnect Director is the Management interface that you work in. As you configure templates and settings here the Direction uses Netconf over SSH to provision the SteelConnect EX devices via the Controller.
SteelConnect EX Controller (Controller)
The controller establishes secure management tunnels to each SteelConnect EX. The Controller acts as a BGP route-reflector, reflecting overlay prefixes to each site to establish reachability between sites using the SD-WAN overlay.
SteelConnect EX Analytics (Analytics)
SteelConnect Analytics receives all telemetry information from the SteelConnect EX sites and provides you with that data by means of dashboards and log files.
Installing the SD-WAN Headend
There are several steps that must be followed to install a headend. One item to note is that the headend may live in the data center, but it is not part of the data plane. To establish connectivity from the SD-WAN overlay to the data center, a SteelConnect EX FlexVNF must be installed in the data center. Let’s walk through the configuration of the headend.
Step 1: Add headend components to topology
For the purpose of this article, I’m going to make the assumption that the network infrastructure is already configured to support the addition of our three new devices: Director, Controller, and Analytics. We will add them according to the following diagram.
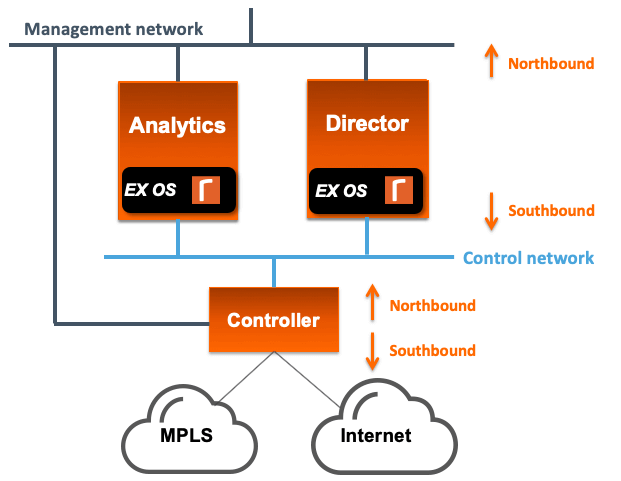
To elaborate a bit further on the diagram, all devices define ethernet0 as the management interface and thus the Director, Controller, and Analytics are connected to the management network on ethernet. From the point of view of the SteelConnect Director, the GUI management performed by an admin is done via the Northbound interface. This is also where API calls happen. We use the Director southbound interface, in this case, ethernet1, as the control network.
Step 2: Perform the initial setup of the SteelConnect Director
The implement the Director, we must begin by following these steps:
- Open up the Director CLI
- Log in to the Director using the default credentials
- Perform the initial setup script.
Below is a CLI output of the Director. As you’ll note, upon initial login with the Administrator account we are automatically prompted to enter the setup. Answering yes to this prompt begins the setup script.
Ubuntu 14.04.6 LTS Director-1 ttyS0

Director-1 login: Administrator
Password:
===============================================================================
WARNING!
This is a Proprietary System
You have accessed a Proprietary System

If you are not authorized to use this computer system, you MUST log off now.
Unauthorized use of this computer system, including unauthorized attempts or
acts to deny service on, upload information to, download information from,
change information on, or access a non-public site from, this computer system,
are strictly prohibited and may be punishable under federal and state criminal
and civil laws. All data contained on this computer systems may be monitored,
intercepted, recorded, read, copied, or captured in any manner by authorized
System personnel. System personnel may use or transfer this data as required or
permitted under applicable law. Without limiting the previous sentence, system
personnel may give to law enforcement officials any potential evidence of crime
found on this computer system. Use of this system by any user, authorized or
unauthorized, constitutes EXPRESS CONSENT to this monitoring, interception,
recording, reading, copying, or capturing, and use and transfer. Please verify
if this is the current version of the banner when deploying to the system.
===============================================================================

  ____  _                _              _
 |  _ \(_)_   _____ _ __| |__   ___  __| |
 | |_) | \ \ / / _ \ '__| '_ \ / _ \/ _` |
 |  _ <| |\ V /  __/ |  | |_) |  __/ (_| |
 |_| \_\_| \_/ \___|_|  |_.__/ \___|\__,_|
  ____  _            _  ____                            _     _______  __
 / ___|| |_ ___  ___| |/ ___|___  _ __  _ __   ___  ___| |_  | ____\ \/ /
 \___ \| __/ _ \/ _ \ | |   / _ \| '_ \| '_ \ / _ \/ __| __| |  _|  \  /
  ___) | ||  __/  __/ | |__| (_) | | | | | | |  __/ (__| |_  | |___ /  \
 |____/ \__\___|\___|_|\____\___/|_| |_|_| |_|\___|\___|\__| |_____/_/\_\
 Release     : 16.1R2
Release date: 20191101
Package ID  : 117dde1
------------------------------------
VERSA DIRECTOR SETUP
-bash: /var/log/vnms/setup.log: Permission denied
------------------------------------
Do you want to enter setup? (y/n)? y
[sudo] password for Administrator:
------------------------------------
Running /opt/versa/vnms/scripts/vnms-startup.sh ...
------------------------------------
Do you want to setup hostname for system? (y/n)? y
Enter hostname: Director-1
Added new hostname entry to /etc/hosts
Added new hostname entry to /etc/hostname
Restarting network service ...
Do you want to setup network interface configuration? (y/n)? y
------------------------------------
Setup Network Interfaces
------------------------------------
Enter interface name [eg. eth0]: eth0
Existing IP for eth0 is 192.168.122.174
Configuration present for eth0, do you want to re-configure? (y/n)? 192.168.122.174
Answer not understood
Configuration present for eth0, do you want to re-configure? (y/n)? y
Re-configuring interface eth0
Enter IP Address: 192.168.122.174
Enter Netmask Address: 255.255.255.0
Configure Gateway Address? (y/n)? y
Enter Gateway Address: 192.168.122.1
------------------------------------
Adding default route - route add default gw 192.168.122.1
Added interface eth0
Configure another interface? (y/n)? y
Enter interface name [eg. eth0]: eth1
Existing IP for eth1 is 10.100.3.10
Configuration present for eth1, do you want to re-configure? (y/n)? y
Re-configuring interface eth1
Enter IP Address: 10.100.3.10
Enter Netmask Address: 255.255.255.0
------------------------------------
Added interface eth1
Configure another interface? (y/n)? n
Configure North-Bound interface (If not configured, default 0.0.0.0 will be accepted) (y/n)? y
------------------------------------
Select North-Bound Interface
------------------------------------
Enter interface name [eg. eth0]: eth0
------------------------------------
Select South-Bound Interface(s)
------------------------------------
Enter interface name [eg. eth0]: eth1
Configure another South-Bound interface? (y/n)? n
Restarting network service ...
Enable secure mode for Director HA ports? (y/n)? n
 => Clearing VNMSHA iptables rules
 => Persist iptable rules and reload..
 => Done.
Secure Director HA communication? (y/n)? n
 => Clearing strongSwan ipsec configuration..
 => Restarting ipsec service..
 => Done.
Prompt to set new password at first time UI login? (y/n)? n
Restarting versa director services, please standby ...
------------------------------------
Stopping VNMS service
------------------------------------
Stopping VNMS:TOMCAT.............[Stopped]
Stopping VNMS:KARAF..............[Stopped]
Stopping VNMS:REDIS..............[Stopped]
Stopping VNMS:POSTGRE............[Stopped]
Stopping VNMS:SPRING-BOOT........[Stopped]
Stopping VNMS:SPACKMGR...........[Stopped]
Stopping VNMS:NCS................[Stopped]
 * Stopping daemon monitor monit
   ...done.
  ____  _                _              _
 |  _ \(_)_   _____ _ __| |__   ___  __| |
 | |_) | \ \ / / _ \ '__| '_ \ / _ \/ _` |
 |  _ <| |\ V /  __/ |  | |_) |  __/ (_| |
 |_| \_\_| \_/ \___|_|  |_.__/ \___|\__,_|
  ____  _            _  ____                            _     _______  __
 / ___|| |_ ___  ___| |/ ___|___  _ __  _ __   ___  ___| |_  | ____\ \/ /
 \___ \| __/ _ \/ _ \ | |   / _ \| '_ \| '_ \ / _ \/ __| __| |  _|  \  /
  ___) | ||  __/  __/ | |__| (_) | | | | | | |  __/ (__| |_  | |___ /  \
 |____/ \__\___|\___|_|\____\___/|_| |_|_| |_|\___|\___|\__| |_____/_/\_\
 Starting VNMS service
------------------------------------
Starting VNMS:NCS................[Started]
Starting VNMS:POSTGRE............[Started]
Starting VNMS:SPRING-BOOT........[Started]
Starting VNMS:REDIS..............[Started]
Starting VNMS:KARAF..............[Started]
Starting VNMS:TOMCAT.............[Started]
------------------------------------
Completed Setup
------------------------------------
Press ENTER to continue
------------------------------------
To run setup manually: /opt/versa/vnms/scripts/vnms-startup.sh
------------------------------------
Once you’ve finished the script you’ll need to reboot the server. I’ll do that in the following output.
Ubuntu 14.04.6 LTS Director-1 ttyS0

Director-1 login: Administrator
Password:
Last login: Mon Mar 16 22:23:09 UTC 2020 on ttyS0
===============================================================================
WARNING!
This is a Proprietary System
You have accessed a Proprietary System

If you are not authorized to use this computer system, you MUST log off now.
Unauthorized use of this computer system, including unauthorized attempts or
acts to deny service on, upload information to, download information from,
change information on, or access a non-public site from, this computer system,
are strictly prohibited and may be punishable under federal and state criminal
and civil laws. All data contained on this computer systems may be monitored,
intercepted, recorded, read, copied, or captured in any manner by authorized
System personnel. System personnel may use or transfer this data as required or
permitted under applicable law. Without limiting the previous sentence, system
personnel may give to law enforcement officials any potential evidence of crime
found on this computer system. Use of this system by any user, authorized or
unauthorized, constitutes EXPRESS CONSENT to this monitoring, interception,
recording, reading, copying, or capturing, and use and transfer. Please verify
if this is the current version of the banner when deploying to the system.
===============================================================================

  ____  _                _              _
 |  _ \(_)_   _____ _ __| |__   ___  __| |
 | |_) | \ \ / / _ \ '__| '_ \ / _ \/ _` |
 |  _ <| |\ V /  __/ |  | |_) |  __/ (_| |
 |_| \_\_| \_/ \___|_|  |_.__/ \___|\__,_|
  ____  _            _  ____                            _     _______  __
 / ___|| |_ ___  ___| |/ ___|___  _ __  _ __   ___  ___| |_  | ____\ \/ /
 \___ \| __/ _ \/ _ \ | |   / _ \| '_ \| '_ \ / _ \/ __| __| |  _|  \  /
  ___) | ||  __/  __/ | |__| (_) | | | | | | |  __/ (__| |_  | |___ /  \
 |____/ \__\___|\___|_|\____\___/|_| |_|_| |_|\___|\___|\__| |_____/_/\_\
 Release     : 16.1R2
Release date: 20191101
Package ID  : 117dde1
[Administrator@Director-1: ~] $ sudo reboot
[sudo] password for Administrator:

Broadcast message from Administrator@Director-1
        (/dev/ttyS0) at 22:29 ...

The system is going down for reboot NOW!
[Administrator@Director-1: ~] $
Ubuntu 14.04.6 LTS Director-1 ttyS0

Director-1 login:
Step 3: Perform the initial setup of Analytics
The next step in bringing up a headend is to configure the Analytics server. Analytics and Director will need to communicate securely so we are going to setup the network configuration first, then we are going to sync certificates between the two. Perform the following tasks to implement the Analytics server.
- Double click on the Analytics icon to open up the CLI
- Log into Analytics with the credentials “versa/versa123”
- Edit the /etc/network/interfaces file with static IP addressing.
Use
sudo nano /etc/network/interfaces for task 3 above.
 GNU nano 2.2.6         File: /etc/network/interfaces                Modified

# This file describes the network interfaces available on your system
# and how to activate them. For more information, see interfaces(5).

# The loopback network interface
auto lo
iface lo inet loopback

# The primary network interface
auto eth0
iface eth0 inet static
address 192.168.122.175
netmask 255.255.255.0
gateway 192.168.122.1

auto eth1
iface eth1 inet static
address 10.100.3.11
netmask 255.255.255.0
Next, bounce each interface.
[versa@versa-analytics: ~] $ sudo ifdown eth0
[versa@versa-analytics: ~] $ sudo ifdown eth1
ifdown: interface eth1 not configured
[versa@versa-analytics: ~] $ sudo ifup eth0
[versa@versa-analytics: ~] $ sudo ifup eth1
[versa@versa-analytics: ~] $
Once the interfaces have been bounced we need to confirm the IP addressing and ping the Director. I’ll do that in the following output.
[versa@versa-analytics: ~] $ ip a
1: lo: <LOOPBACK,UP,LOWER_UP> mtu 65536 qdisc noqueue state UNKNOWN group default qlen 1
    link/loopback 00:00:00:00:00:00 brd 00:00:00:00:00:00
    inet 127.0.0.1/8 scope host lo
       valid_lft forever preferred_lft forever
    inet6 ::1/128 scope host
       valid_lft forever preferred_lft forever
2: eth0: <BROADCAST,MULTICAST,UP,LOWER_UP> mtu 1500 qdisc pfifo_fast state UP group default qlen 1000
    link/ether 0c:5d:40:dd:78:00 brd ff:ff:ff:ff:ff:ff
    inet 192.168.122.175/24 brd 192.168.122.255 scope global eth0
       valid_lft forever preferred_lft forever
    inet6 fe80::e5d:40ff:fedd:7800/64 scope link
       valid_lft forever preferred_lft forever
3: eth1: <BROADCAST,MULTICAST,UP,LOWER_UP> mtu 1500 qdisc pfifo_fast state UP group default qlen 1000
    link/ether 0c:5d:40:dd:78:01 brd ff:ff:ff:ff:ff:ff
    inet 10.100.3.11/24 brd 10.100.3.255 scope global eth1
       valid_lft forever preferred_lft forever
    inet6 fe80::e5d:40ff:fedd:7801/64 scope link
       valid_lft forever preferred_lft forever
4: eth2: <BROADCAST,MULTICAST> mtu 1500 qdisc noop state DOWN group default qlen 1000
    link/ether 0c:5d:40:dd:78:02 brd ff:ff:ff:ff:ff:ff
[versa@versa-analytics: ~] $ ping 192.168.122.174
PING 192.168.122.174 (192.168.122.174) 56(84) bytes of data.
64 bytes from 192.168.122.174: icmp_seq=1 ttl=64 time=1.38 ms
64 bytes from 192.168.122.174: icmp_seq=2 ttl=64 time=0.895 ms
^C
--- 192.168.122.174 ping statistics ---
2 packets transmitted, 2 received, 0% packet loss, time 1001ms
rtt min/avg/max/mdev = 0.895/1.140/1.385/0.245 ms
[versa@versa-analytics: ~] $
Now that I have the basic connectivity from Analytics I need to add resolution for Director–1. This step is important because later on, I need to register the Director with the Analytics server in the GUI interface and this is done by name. That name must be resolvable.
[versa@versa-analytics: ~] $ sudo nano /etc/hosts
  1 127.0.0.1   localhost
  2 127.0.1.1   versa-analytics
  3 192.168.122.174 Director-1
  4
  5 # The following lines are desirable for IPv6 capable hosts
  6 ::1     localhost ip6-localhost ip6-loopback
  7 ff02::1 ip6-allnodes
  8 ff02::2 ip6-allrouters
Now we need to navigate to the scripts directory so we can run the vansetup script.
[versa@versa-analytics: ~] cd /opt/versa/scripts/van-scripts
Now that I’m in the van-scripts directory I can execute the vansetup python script
[versa@versa-analytics: van-scripts] $ sudo ./vansetup.py
[sudo] password for versa:
/usr/local/lib/python2.7/dist-packages/cassandra_driver-2.1.3.post-py2.7-linux-x86_64.egg/cassandra/util.py:360: UserWarning: The blist library is not available, so a pure python list-based set will be used in place of blist.sortedset for set collection values. You can find the blist library here: https://pypi.python.org/pypi/blist/
VAN Setup configuration start
<-- output omitted -->

Update config files
As the script runs you will be asked to delete the database. We want to do this so that it’s rebuilt from scratch with no existing data. Basically, we want a fresh start.
Delete the database? (y/N) y

Proceeding to delete the database in 5 seconds
Next, we will reboot when prompted to do so.
Reboot the node(recommended)? (y/N) y
After the reboot, we want to identify if the database successfully restarted after we deleted it. To perform this task you need to scroll up into the output text and find the statement that identifies a successful restart of the Cassandra database. You can see an example of the output you’re looking for below.
DSE daemon starting with Solr enabled (edit /etc/default/dse to disable)
   ...done.
Waiting for host 127.0.0.1 to come up
0
UN  127.0.0.1  53.6 KB    ?       fa7139b0-77c1-4b0f-a967-6d754ea7aa28  -3572760821973264000                     RAC1
We can also check the state of the database after reboot by logging back in and using the nodetool status command. Specifically, look for the UN that indicates the database is UP and NORMAL. This is the same output that you would have f0und by scrolling back up through the script output.
[versa@versa-analytics: ~] $ nodetool status
Datacenter: Search-Analytics
============================
Status=Up/Down
|/ State=Normal/Leaving/Joining/Moving
--  Address    Load       Owns    Host ID                               Token                                    Rack
UN  127.0.0.1  287.27 KB  ?       fa7139b0-77c1-4b0f-a967-6d754ea7aa28  -3572760821973264000                     RAC1

Note: Non-system keyspaces don't have the same replication settings, effective ownership information is meaningless
[versa@versa-analytics: ~] $
Now we are going to enter the CLI of Analytics. You access the CLI by entering the command cli. You can see this below.
[versa@versa-analytics: ~] $ cli

versa connected from 127.0.0.1 using console on versa-analytics
versa@versa-analytics>
Next, we will enter the configuration mode using the configure command.
versa@versa-analytics> configure
Entering configuration mode private
[ok][2019-07-14 15:42:01]

[edit]
versa@versa-analytics%
Now that we are in configuration mode, we want to set the analytics node to the southbound interface IP address. This will also include defining the port to use for communication, the storage directory, and the format. Here’s the information we need:
- Use Port 1234
- Set the storage directory to /var/tmp/log
- Use the syslog format
versa@versa-analytics% set log-collector-exporter local collectors VAN address 10.100.3.11 port 1234 storage directory /var/tmp/log format syslog
[ok][2019-07-14 15:48:24]
Now we need to commit the changes and exit. You can see that in the following output.
versa@versa-analytics% commit
Commit complete.
[ok][2019-07-14 15:49:24]

[edit]
versa@versa-analytics% exit
[ok][2019-07-14 15:49:26]
versa@versa-analytics> exit
[versa@versa-analytics: ~] $
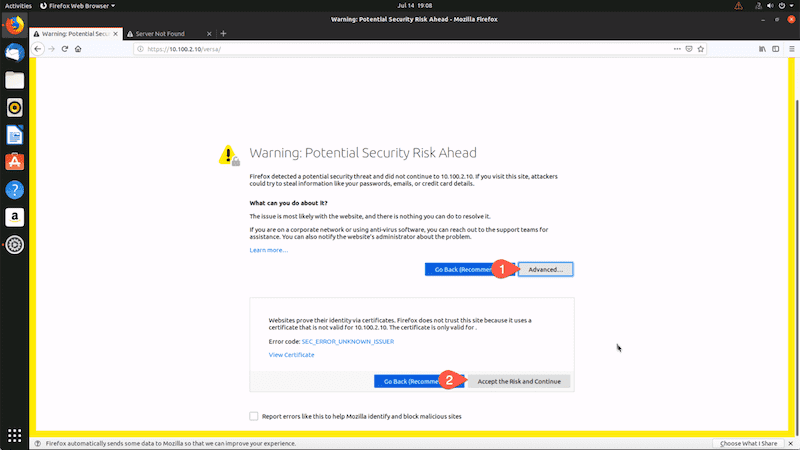
Step 4: Connect to the Director Web Interface
My next step will be to connect to the Director GUI. We browse to the northbound interface IP address, which is the address we set on eth0 earlier. The screenshot below is not using the same IP address that we configured, but hopefully, you get the point. It’s an HTTPS connection and we are going to be warned about the self-signed certificate. Once you accept the certificate you can log in with the Administrator credentials.
Next, log in to the Director with the default credentials.

You’ll be asked to reset the password for the GUI. Follow those instructions and click change.
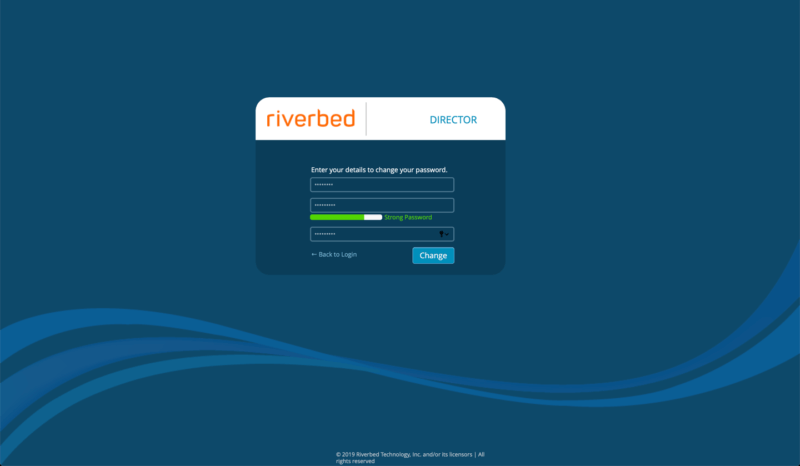
Now we need to log in a second time with the new credentials.
The new password is only used for the GUI.

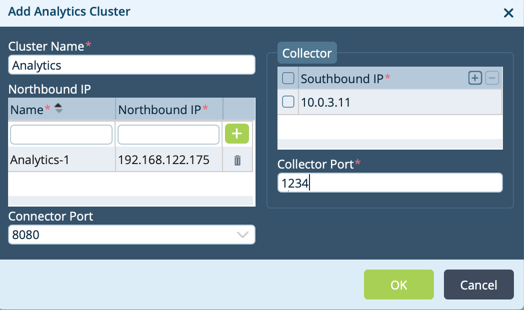
Step 5: Define the Analytics Cluster
After we’ve logged into the Director GUI we need to define our analytics cluster. To do so, navigate to Administration>Connectors>Analytics Cluster and click the + button to add a new Analytics Cluster. The northbound IP of our analytics cluster is 192.168.122.175 and the southbound IP is 10.100.3.110 (Yes, there is a type in my screenshot).
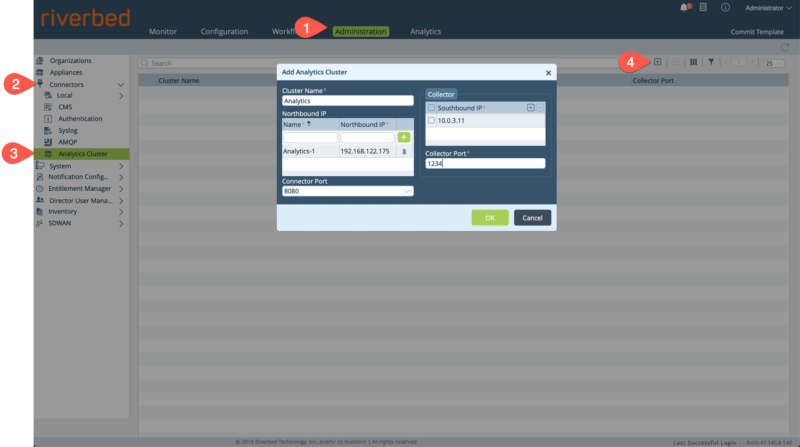
You’ll also notice that we give the cluster a name, in this case, Analytics, and we also name the northbound IP Analytics-1. Also, the connector port is left at the default value of 8080. We will use this port to connect to the Analytics GUI later on.
Step 6: Generate and Sync certificates between Director and Analytics
Now that the Analytics cluster has been defined in the Director GUI we need to sync certificates between the two. To do so we will generate the certificate from the CLI of the Director. This is seen in the following output from the director CLI.
Director-1 login: Administrator
Password:
Last login: Mon Mar 16 22:28:56 UTC 2020 on ttyS0
===============================================================================
WARNING!
This is a Proprietary System
You have accessed a Proprietary System

If you are not authorized to use this computer system, you MUST log off now.
Unauthorized use of this computer system, including unauthorized attempts or
acts to deny service on, upload information to, download information from,
change information on, or access a non-public site from, this computer system,
are strictly prohibited and may be punishable under federal and state criminal
and civil laws. All data contained on this computer systems may be monitored,
intercepted, recorded, read, copied, or captured in any manner by authorized
System personnel. System personnel may use or transfer this data as required or
permitted under applicable law. Without limiting the previous sentence, system
personnel may give to law enforcement officials any potential evidence of crime
found on this computer system. Use of this system by any user, authorized or
unauthorized, constitutes EXPRESS CONSENT to this monitoring, interception,
recording, reading, copying, or capturing, and use and transfer. Please verify
if this is the current version of the banner when deploying to the system.
===============================================================================

  ____  _                _              _
 |  _ \(_)_   _____ _ __| |__   ___  __| |
 | |_) | \ \ / / _ \ '__| '_ \ / _ \/ _` |
 |  _ <| |\ V /  __/ |  | |_) |  __/ (_| |
 |_| \_\_| \_/ \___|_|  |_.__/ \___|\__,_|
  ____  _            _  ____                            _     _______  __
 / ___|| |_ ___  ___| |/ ___|___  _ __  _ __   ___  ___| |_  | ____\ \/ /
 \___ \| __/ _ \/ _ \ | |   / _ \| '_ \| '_ \ / _ \/ __| __| |  _|  \  /
  ___) | ||  __/  __/ | |__| (_) | | | | | | |  __/ (__| |_  | |___ /  \
 |____/ \__\___|\___|_|\____\___/|_| |_|_| |_|\___|\___|\__| |_____/_/\_\
 Release     : 16.1R2
Release date: 20191101
Package ID  : 117dde1
[Administrator@Director-1: ~] $ cd /opt/versa/vnms/scripts/
[Administrator@Director-1: scripts] $ sudo su versa
[sudo] password for Administrator:
orepass versa123 --overwritevnms/scripts$ ./vnms-certgen.sh --cn Director-1 --st
 => Generating certificate for domain: Director-1
 => Generating ca_config.cnf
 => Generated CA key and CA cert files
 => Generating SSO certificates
 => Generating websockify certificates
 => Saving storepass and keypass
This must be done from the user account versa. After generating the certificate be sure to exit this user and return to Administrator.
Next, we will sync the certificate with Analytics. This is done using the vnms-cert-sync.py script. The script SCP’s the certificate to the correct location on Analytics.
versa@Director-1:/opt/versa/vnms/scripts$ exit
exit
[Administrator@Director-1: scripts] $ ./vnms-cert-sync.sh --sync
Syncing Director certificates to VAN CLuster
Enter VAN Cluster Name:
Analytics
VAN Clusters IPs: 192.168.122.175
Attempting Key Based Auth..
Can we pick Private Key from ~/.ssh/id_rsa[y/n]y
Enter password for Versa User for sudo:
Password:
[Errno 2] No such file or directory: '/home/Administrator/.ssh/id_rsa'
Looks like SSH Key exchange not setup, falling back to password
Please Enter password for User - versa:
Password:
/usr/lib/python2.7/dist-packages/Crypto/Cipher/blockalgo.py:141: FutureWarning: CTR mode needs counter parameter, not IV
  self._cipher = factory.new(key, *args, **kwargs)
Connected to 192.168.122.175
[sudo] password for versa: rm: cannot remove '/opt/versa/var/van-app/certificates/versa_director_client.cer': No such file or directory

[sudo] password for versa: rm: cannot remove '/opt/versa/var/van-app/certificates/versa_director_truststore.ts': No such file or directory

DEleted Existing Certificate
SFTPed certificate File
Locate keytool utility:

/usr/lib/jvm/jre1.8.0_231/bin/keytool

Copy certificate:

Certificate: /opt/versa/var/van-app/certificates/versa_director_client.cer

 * Stopping versa-confd

 * Stopping versa-lced

 * -n  ... waiting for versa-lced to exit

 * Stopping versa-analytics-app

 * -n  ... waiting for versa-analytics-app to exit

 * Stopping daemon monitor monit

   ...done.

 * Versa Analytics Stopped

   ...done.

   ...done.

 * Restarting daemon monitor monit

   ...done.

 * Starting versa-analytics-app

 * Versa Analytics Started


             .---.,

            (      ``.

       _     \        )    __      ________ _____   _____

      (  `.   \      /     \ \    / /  ____|  __ \ / ____|  /\

       \    `. )    /       \ \  / /| |__  | |__) | (___   /  \

        \     |    /         \ \/ / |  __| |  _  / \___ \ / /\ \

         \    |   /           \  /  | |____| | \ \ ____) / ____ \

          \   |  /             \/   |______|_|  \_\_____/_/    \_\

           \  | /

            \_|/                   _   _  _   _   _ __   _______ ___ ___ ___

                                  /_\ | \| | /_\ | |\ \ / /_   _|_ _/ __/ __|

                                 / _ \| .` |/ _ \| |_\ V /  | |  | | (__\__ \

                                /_/ \_\_|\_/_/ \_\____|_|   |_| |___\___|___/


[sudo] password for versa: cp: '/opt/versa/var/van-app/certificates/versa_director_client.cer' and '/opt/versa/var/van-app/certificates/versa_director_client.cer' are the same file

Certificate was added to keystore

Certificate Installed
Next, we need to reboot the server.
[Administrator@Director-1: scripts] $ sudo reboot

Broadcast message from Administrator@Director-1
        (/dev/ttyS0) at 22:50 ...

The system is going down for reboot NOW!

Ubuntu 14.04.6 LTS Director-1 ttyS0

Director-1 login:
Step 7: Log in to the Analytics GUI
Now we log into the Analytics GUI using the northbound interface and port 8080.

Step 8: Add the Director hostname
After logging into the Analytics GUI we need to add the Director hostname. Recall earlier when we set up Analytics from the CLI we created a resolution for the Director hostname. To complete this step we need to navigate to Admin>Authentication and add the Director hostname.
This will match the entry placed in /ect/hosts.
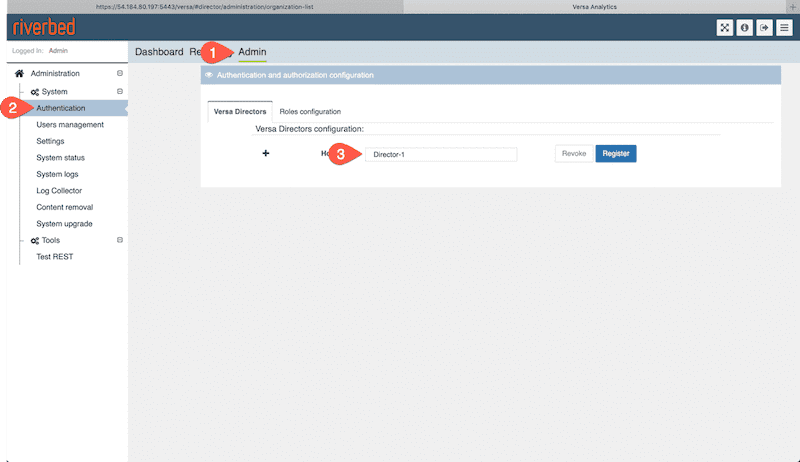
To finish this step, don’t forget to click Register.
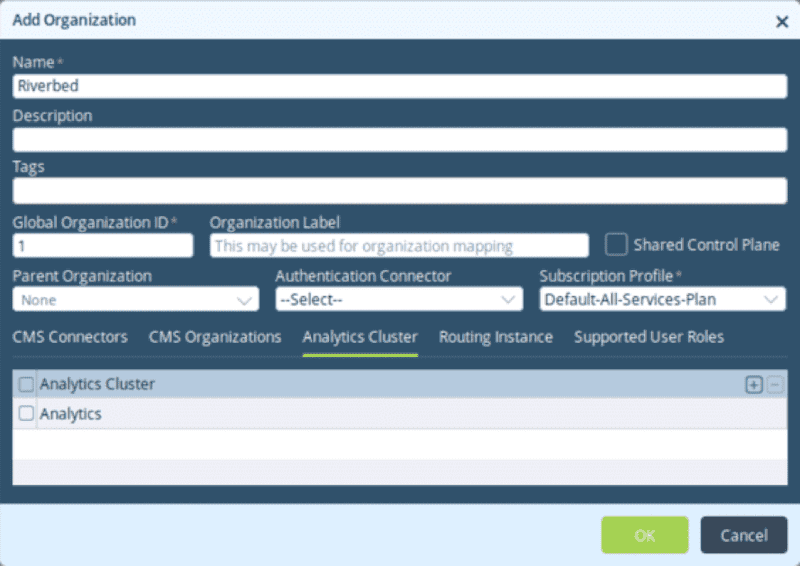
Step 9: Add the first organization
Now we are going to return to the Director GUI and add our first organization. We need a top-level “Parent” organization before we can add any controllers.
- Return to the Director GUI.
- Navigate to Administrator>Organization and click the + button.
- Provide the following values:
| Name | Subscription Profile |
|---|---|
| Riverbed | Default-All-Services-Plan |
- Click on the Analytics Cluster tab.
- Add the Analytics Cluster as seen below.
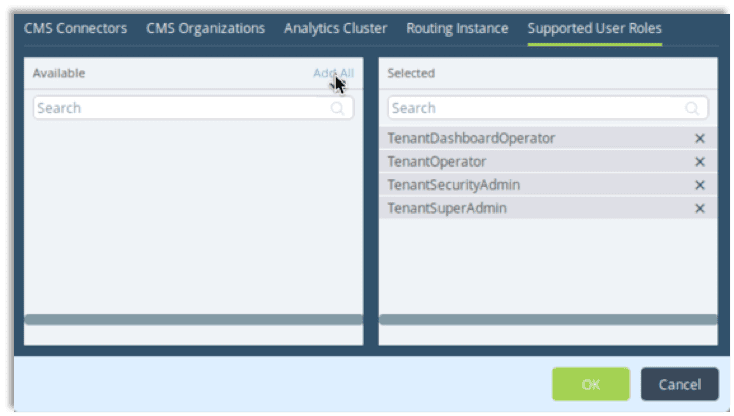
After the analytics cluster has been added we need to navigate to the Supported User Roles tab and add all roles for the parent organization.
- Click on the Supported Users Role tab.
- Click Add All.
Step 10: Configure the Controller IP
Well, we’re getting close to having a functional headend. If you’re still following along you may be thinking that this is a lot of work. In reality, what we’ve done here is not significant. We’ve brought two of the three devices in our headend up and the process has taken us less than an hour. To add to that, this is something you will only do once. After the headend is up and running you’ll mostly work with templates to apply configurations to onboarded branches. We’ll cover that in another article. However, I digress. Let’s return to the process.
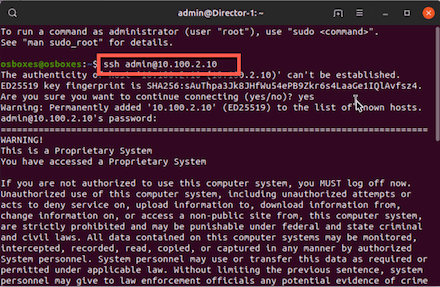
The next step is to deploy the controller. To do so, we need to enable the eth0 interface on the controller itself. Remember that the controller runs SteelConnect EX software, which is the same software as what you will run in the branch. The difference is that it’s defined as a controller in the initial setup. So, let’s follow these steps to bring the controller into the headend deployment.
- Connect to the console of the Controller.
- Login to the controller using the username and password admin/versa123.
- Edit the
/etc/network/interfaces file.
[admin@versa-flexvnf: ~] $ sudo nano /etc/network/interfaces
[sudo] password for admin:
In the interfaces file, set the IP address for the controller based on the table below.
| IP address | Netmask | Gateway |
|---|---|---|
| 192.168.122.176 | 255.255.255.0 | 192.168.122.1 |
You can see an example of the configuration file below.
# This file describes the network interfaces available on your system
# and how to activate them. For more information, see interfaces(5).

# The loopback network interface
auto lo
iface lo inet loopback

# The primary network interface
auto eth0
iface eth0 inet static
address 192.168.122.176
netmask 255.255.255.0
gateway 192.168.122.1
Now we need to bounce the interface.
[admin@versa-flexvnf: ~] $ sudo ifdown eth0
RTNETLINK answers: No such process
[admin@versa-flexvnf: ~] $ sudo ifup eth0
[admin@versa-flexvnf: ~] $
And of course, we want to ping the Director to make sure we have connectivity. Once this is done we can move on to deploy the controller in the Director GUI.
[admin@versa-flexvnf: ~] $ ping 192.168.122.174
PING 192.168.122.174 (192.168.122.174) 56(84) bytes of data.
64 bytes from 192.168.122.174: icmp_seq=1 ttl=64 time=1.28 ms
64 bytes from 192.168.122.174: icmp_seq=2 ttl=64 time=0.782 ms
^C
--- 192.168.122.174 ping statistics ---
2 packets transmitted, 2 received, 0% packet loss, time 1000ms
rtt min/avg/max/mdev = 0.782/1.034/1.286/0.252 ms
[admin@versa-flexvnf: ~] $
Step 11: Deploy the Controller in the Director GUI
The next step is to deploy the controller in the Director GUI. We’re going to deploy the controller in the Riverbed organization. Remember that this was our parent organization. We can use this organization as our only organization or we can deploy multiple tenants with SteelConnect EX. For our examples in this blog series, we will use a single-tenant, Riverbed. Follow these steps to deploy the controller.
- Return to the Director GUI.
- Navigate to Workflows>Infrastructure>Controllers
- Click the + button to add a workflow.
- Provide the following elements to the General page.
- Name.
- Provider Organization.
- Check Staging Controller.
- Enter the IP address that you applied in the previous step.
- Select the Analytics cluster.
- Click Continue
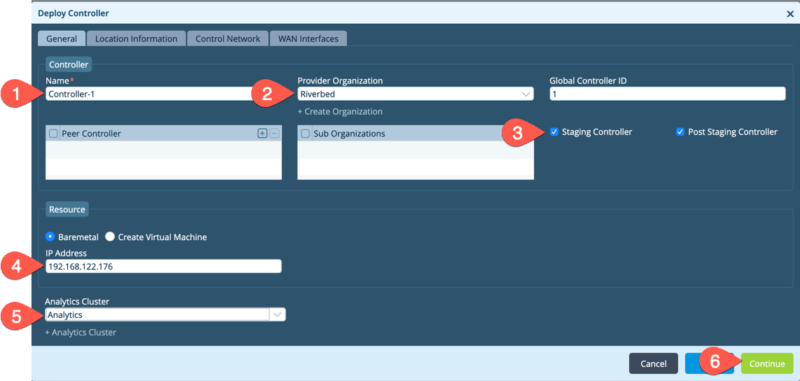
When you enter the IP address of the controller it will test connectivity. You will see this in the window in the form of a spinning image, although it may be brief.
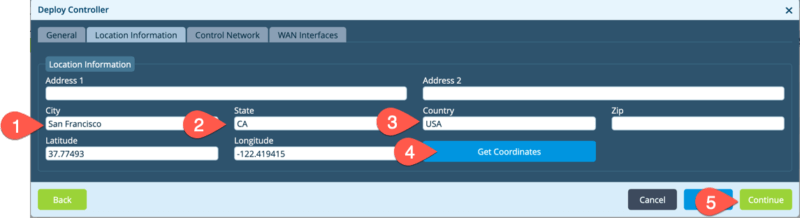
Next, enter location information. This requires City, State, Country and then clicking Get Coordinates, in which the Lattitude and Longitude will be populated. Then you can click Continue.
On the next tab, you need to enter the Control Network information, which includes the Network Name, interface, and IP address, as seen in the image below. Click Continue when the values have been entered.
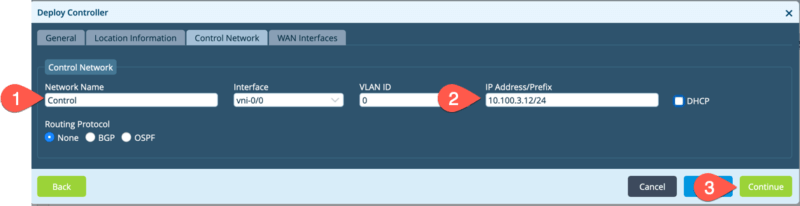
On the controller, eth0 is connected to the management network. eth1 is connected to the control network but within the cli of the controller it is identified as vni–0/0/. This means eth2 will be identified in the controller cli as vni–0/1 and is connected to the MPLS network via the MPLS_SWITCH.
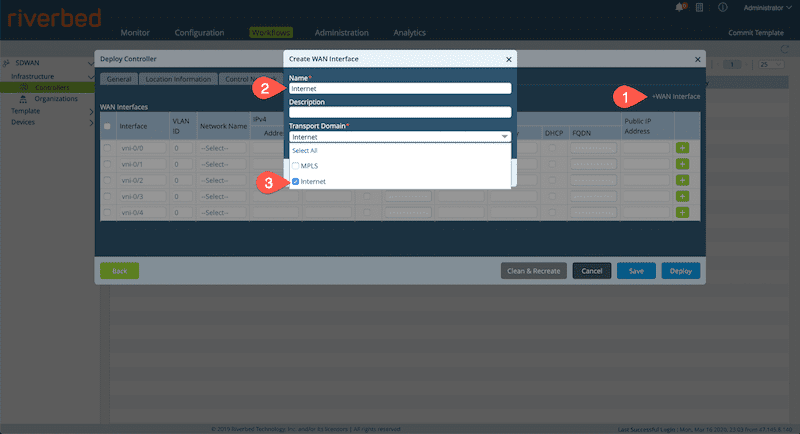
Next, configure the WAN interfaces. This task has multiple substeps as seen below. You need to repeat the following process for MPLS.
- Click on the +WAN Interface link on the top right side of the interface.
- Create an interface names Internet and select Internet as the Transport Domain.
- Click OK.
Now select the VNI interfaces that connect to Internet and MPLS.
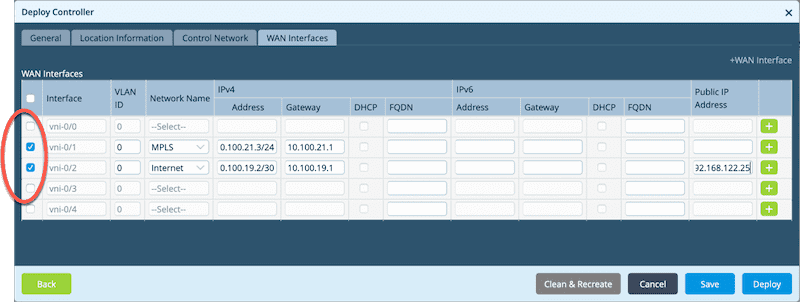
In our topology, VNI–0/1 is eth2 and VNI–0/2 is eth3. This is important because eth0 is connected to the management network, the northbound side of Director, and eth1 is connected to the control network, the southbound side of Director.
Select the appropriate network names, and provide the IP address and gateway for each. There’s a table below to show you the values I used.
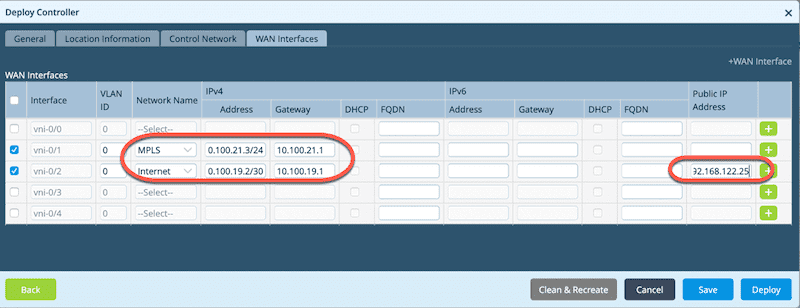
| Network Name | IP address | Mask | Gateway | Public IP |
|---|---|---|---|---|
| MPLS | 10.100.21.3 | /24 | 10.100.21.1 | |
| Internet | 10.100.19.2 | /30 | 10.100.19.1 | 192.168.122.25 |
Also, an important step for us here is that we need to advertise a public IP address for the Internet-Only branches to reach the controller. If we fail to add the public IP address here when an Internet-only branch is onboarded they will not be able to reach the controller. That being said, we also need to make sure that Static NAT and Access Rules are configured on the perimeter firewall (I’m not showing that in this article).
To finish things up you need to click Deploy. When you click deploy you should see a popup asking you to create the overlay scheme. Be careful here to allocate this addressing based on the sizing of your organization. Using a /24 would limit you to 256 branch sites as this space is used to address each site in the SD-WAN fabric.
In the following output, I have entered the IPv4-Prefix for the overlay addressing pool, as well as the maximum number of organizations as seen below. Therefore each organization has around 65K branch sites that we can address, not that we would have that many.
| IPv4-Prefix | Maximum Organizations |
|---|---|
| 10.254.0.0/16 | 16 |
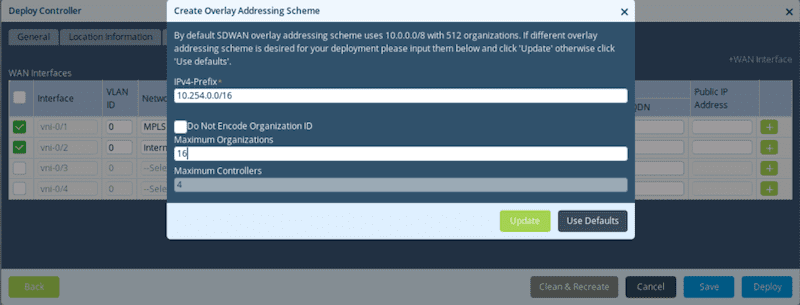
I’ll wrap this up by clicking Update.
Note in the bottom of the Director GUI that the controller workflow is immediately deployed.
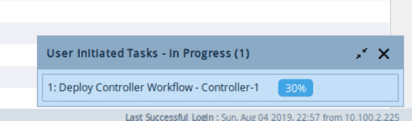
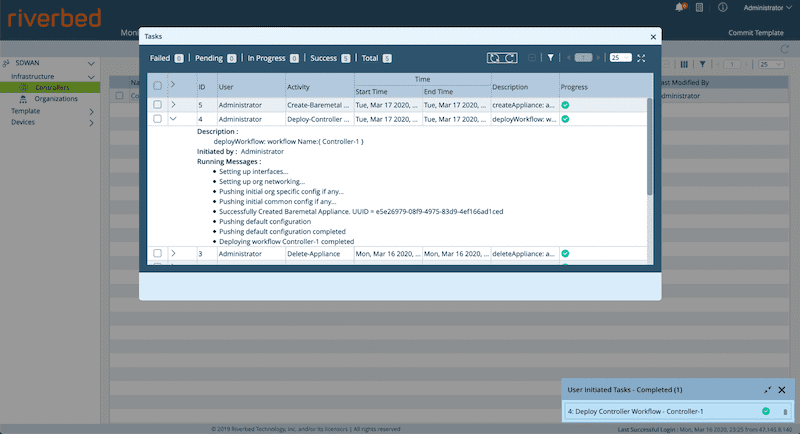
Step 12: View the progress of the controller deployment
There is a tasks view that we can open to see the progress. You can access this in the Director GUI by clicking the Tasks icon. This is the icon on the top right-hand side of the interface that looks like a checklist. This will open a list of tasks that you can expand and view as seen below. In the following output, you can see that the controller was deployed and in the running messages, you can see what happened at each step of the deployment that took place behind the scenes.
Step 13: Log in to the Controller CLI and confirm the deployment.
Next, we are going to connect to the command line of the controller and have a look at how to verify the deployment there.
In the following output, you can see that I have accessed the CLI.
[admin@Controller-1: ~] $ cli


             .---.,
            (      ``.
       _     \        )    __      ________ _____   _____
      (  `.   \      /     \ \    / /  ____|  __ \ / ____|  /\
       \    `. )    /       \ \  / /| |__  | |__) | (___   /  \
        \     |    /         \ \/ / |  __| |  _  / \___ \ / /\ \
         \    |   /           \  /  | |____| | \ \ ____) / ____ \
          \   |  /             \/   |______|_|  \_\_____/_/    \_\
           \  | /
            \_|/                   _  _ ___ _______      _____  ___ _  _____
                                  | \| | __|_   _\ \    / / _ \| _ \ |/ / __|
                                  | .` | _|  | |  \ \/\/ / (_) |   / ' <\__ \
                                  |_|\_|___| |_|   \_/\_/ \___/|_|_\_|\_\___/


admin connected from 127.0.0.1 using console on Controller-1
admin@Controller-1-cli>
Once I’m in the CLI, I can use the show interfaces brief | tab command to view the interfaces that have been configured. You can see a sample of that output below. Let’s dig into what we’re seeing here.
admin@Controller-1-cli> show interfaces brief | tab
NAME         MAC                OPER  ADMIN  TENANT  VRF                    IP
------------------------------------------------------------------------------------------------
eth-0/0      0c:5d:40:be:eb:00  up    up     0       global                 192.168.122.176/24
tvi-0/2      n/a                up    up     -       -
tvi-0/2.0    n/a                up    up     1       Riverbed-Control-VR    10.254.16.1/32
tvi-0/3      n/a                up    up     -       -
tvi-0/3.0    n/a                up    up     1       Riverbed-Control-VR    10.254.24.1/32
tvi-0/602    n/a                up    up     -       -
tvi-0/602.0  n/a                up    up     1       Riverbed-Control-VR    169.254.0.2/31
tvi-0/603    n/a                up    up     -       -
tvi-0/603.0  n/a                up    up     1       Analytics-VR           169.254.0.3/31
vni-0/0      0c:5d:40:be:eb:01  up    up     -       -
vni-0/0.0    0c:5d:40:be:eb:01  up    up     1       Riverbed-Control-VR    10.100.3.12/24
vni-0/1      0c:5d:40:be:eb:02  up    up     -       -
vni-0/1.0    0c:5d:40:be:eb:02  up    up     1       MPLS-Transport-VR      10.100.21.3/24
vni-0/2      0c:5d:40:be:eb:03  up    up     -       -
vni-0/2.0    0c:5d:40:be:eb:03  up    up     1       Internet-Transport-VR  10.100.19.2/30
vni-0/3      0c:5d:40:be:eb:04  down  down   -       -
vni-0/4      0c:5d:40:be:eb:05  down  down   -       -

[ok][2020-03-16 17:06:45]
admin@Controller-1-cli>
In the above output, the IP address assigned to the Riverbed-Control-VR on vni–0/0.0 10.10.254.16.1. This is from the subnet that we defined as the overlay network when we deployed the controller (remember the popup?). The IP address applied to the MPLS-Transport-VR is 10.100.21.3. This was the IP address that you applied to the MPLS interface vni–0/1. The IP address applied to the Internet-Transport-VR is 10.100.19.2. This is the IP address that you assigned to vni–0/2 when you deployed the controller in the Director interface.
Now, this output brings up a very good question. We know what the vni’s are. We assigned IP addresses to them when we onboarded the controller. VNI stands for Virtual Network Interface, and they are virtual in the sense that the controller software maps them to a physical interface on the hardware. For example, since eth0 is used for management, the SteelConnect EX software maps eth1 to vni-0/0 which is the control network, and eth2 gets mapped to vni-0/1. Eth3 then gets mapped to vni-0/2. But what are these TVI’s? We will save the discussion of that topic for another article, however, so that we understand what we are looking at here, a TVI is a Tunnel Virtual Interface. A TVI is not mapped to a physical interface. There are two of each TVI because SteelConnect EX sets up an unencrypted channel as well as an encrypted channel.
tvi-0/2      n/a                up    up     -       -
tvi-0/2.0    n/a                up    up     1       Riverbed-Control-VR    10.254.16.1/32
tvi-0/3      n/a                up    up     -       -
tvi-0/3.0    n/a                up    up     1       Riverbed-Control-VR    10.254.24.1/32
tvi-0/602    n/a                up    up     -       -
tvi-0/602.0  n/a                up    up     1       Riverbed-Control-VR    169.254.0.2/31
tvi-0/603    n/a                up    up     -       -
tvi-0/603.0  n/a                up    up     1       Analytics-VR           169.254.0.3/31
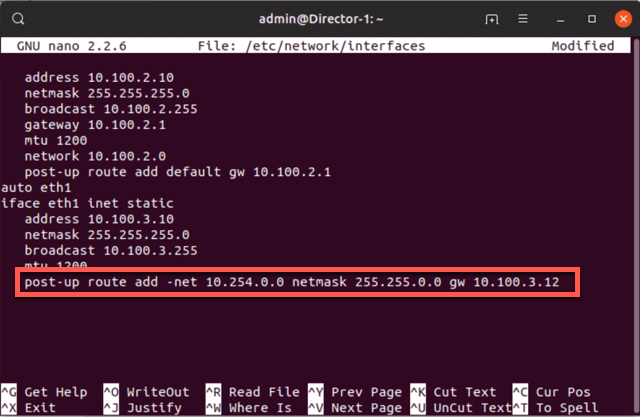
Step 14: Configure a static route for Director
We are so close! This is the final step of my headend deployment and this step is important! We now have to tell the Director how to reach SteelConnect EX Control-VRs or we will not be able to onboard our branches. Recall that the Director has two interfaces: Management and Control. The default route points to the management interface, but the 10.254.0.0/16 overlay network is reachable on the control site or southbound side. This is how the Director connects to the branches via SSH and delivers netfonf connamds. If you miss this step then it just doesn’t work. So, let’s wrap this up. Follow these steps:
- From the director command line edit the
/etc/network/interfaces file. - Add the following line under eth1, the Southbound/Control network.
Enter the following command. You can see an example in the image below.
post-up route add -net 10.254.0.0 netmask 255.255.0.0 gw 10.100.3.12
sudo ifdown eth1
sudo ifup eth1
Next, we make sure that the route has been applied.
admin@Director-1:~$ netstat -rn
Kernel IP routing table
Destination     Gateway            Genmask         Flags   MSS Window  irtt Iface
0.0.0.0         192.168.122.1      0.0.0.0         UG        0 0          0 eth0
10.100.2.0      0.0.0.0            255.255.255.0   U         0 0          0 eth0
10.100.3.0      0.0.0.0            255.255.255.0   U         0 0          0 eth1
10.254.0.0      10.100.3.12        255.255.0.0     UG        0 0          0 eth1
admin@Director-1:~$
And just like that, we have a headend ready to onboard. Let’s take a minute to review what we’ve done here.
Wrap up
We’ve covered a lot of ground in this article. The good news is that this is the most difficult part of the deployment (and it wasn’t even that difficult). But here is what we’re left with at the end of this article:
- The Director has been configured.
- Analytics has been configured.
- We have GUI access to the Director and Analytics.
- The Controller has been configured.
- VNI’s and TVI’s are up on the controller.
Please stay tuned for more articles in this series as we onboard branches, configure routing and traffic steering, and explore the many, many technical features of SteelConnect EX.