In our previous blog post, we highlighted the necessity for Wi-Fi (Wireless LAN) monitoring. We also highlighted some of our newest capabilities in Riverbed NetIM to monitor Wi-Fi. In this post, we aim to dive deeper and establish that Riverbed monitoring tools provide the definitive, complete picture for effectively monitoring Wi-Fi performance.
Wi-Fi performance problems
Wi-Fi performance problems intermingling with application and network issues are expensive to isolate and resolve. If your business depends on strong Wi-Fi performance, you simply must have proper visibility into the various moving parts of Wi-Fi infrastructure. Riverbed’s promise for providing full fidelity observability is not complete until we cover monitoring for this important business asset, Wi-Fi.
How can Riverbed help?
Consider the Wi-Fi infrastructure as LWAP (lightweight access points) and WLC (wireless controllers). For these, Riverbed NetIM can provide numerous health metrics across your entire fleet from basic up or down indicators to radio level signal-to-noise ratio measurements. All makes and models of WLCs and APs monitored via a single tool. In addition, after the COVID-19 pandemic, people started to work from anywhere. As a result, at times there was very little control over the Wi-Fi infrastructure available to users. Therefore, a new challenge emerged for enterprises everywhere for monitoring end user’s devices’ Wi-Fi performance. Because of this, in addition to the infrastructure side, to get the full picture, Riverbed’s End-User-Monitoring (Digital Experience Monitoring) via Aternity provides agents which can be installed to obtain Wi-Fi analytics from end user’s devices.
Wi-Fi infrastructure monitoring
Wi-Fi access points and controllers in most large businesses can be quite expansive. In certain cases, each wireless controller can have a thousand or more access points and the provisioned landscape can change quickly with growth and changes in businesses. Monitoring the health of its various components is an important step toward protecting your investment in Wi-Fi.
Infrastructure side: inventory search/reports
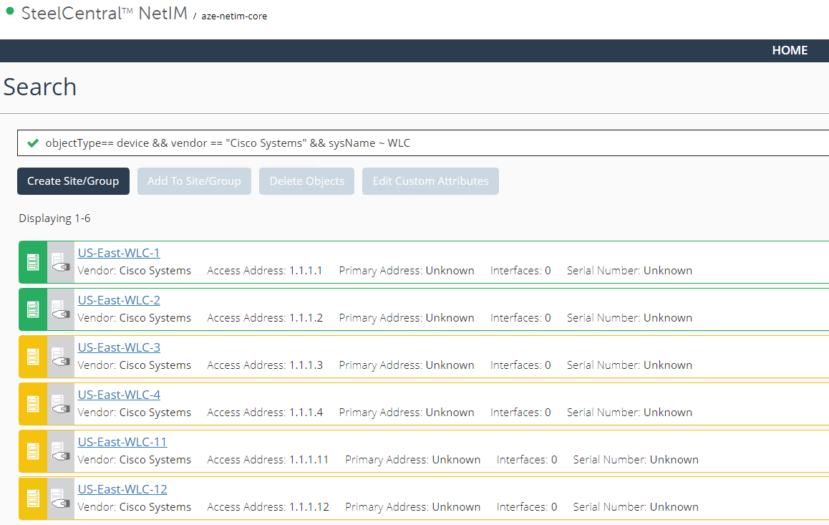
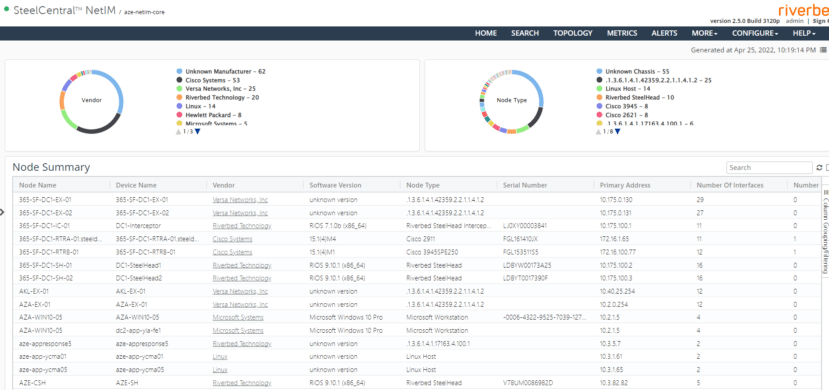
NetIM is not only a monitoring tool but has also been utilized by our customers as an intelligent database with a powerful search engine (pictured below) and REST API on top which is not just a passive inventory. NetIM performs health on all devices in its inventory and can automatically identify, absorb new devices and age out decommissioned devices—based on live SNMP and ICMP polling results. Along with that, there are out-of-the-box reports to summarize vendor types, models, and OS versions of your Wi-Fi fleet.
Infrastructure side: monitoring Wi-Fi health
Basic health metrics mentioned below can be easily obtained across the Wi-Fi infrastructure using Riverbed NetIM.
- Access points operationally up/down
- Wireless Controller CPU Utilization %
- Wireless Controller Memory Utilization %
- Number of APs connected
- Number of active WLANs
Infrastructure side: capacity issues
Oversubscribed Wi-Fi channels at the radio level can seep into your infrastructure like sparse distribution of APs leading to overloaded APs. Riverbed NetIM can provide the below metrics for your APs to better manage ever-changing capacity needs across the Wi-Fi fleet.
- Channel Utilization %
- Channel Rx Utilization %
- Channel Tx Utilization %
- Channel User Count
- Maximum Allowed Clients
Infrastructure side: RF interference effects
Co-channel interference (CCI) can be one of the biggest enemies, but general radio interference can be quite prevalent as well in busy cities and office spaces. Once again, Riverbed NetIM can provide the metrics to enable visibility into these problems. I have used the below metric during my Riverbed consulting days to help customers figure out just exactly how significant is radio interference and SNR quality in various sites.
- Poor SNR Clients
Infrastructure side: client mobility
If you have WLC Mobility enabled in your Wi-Fi deployment, you will find these metrics useful, specifically, if you have IoTs that are highly mobile in a localized space. there are more mobility metrics available inside Riverbed NetIM, below is a curated list of some mobility metrics related to Wi-Fi.
- Total Hand-off Requests
- Total Hand-off Requests Sent
- Total Hand-off Denied Received
End-User Wi-Fi experience monitoring
In cases where a DEM agent can be installed on user’s device, the breadth and depth of visibility and analysis available from Riverbed Aternity DEM solution is unmatched. Below is a curated list or Wi-Fi performance dashboards available from Aternity.
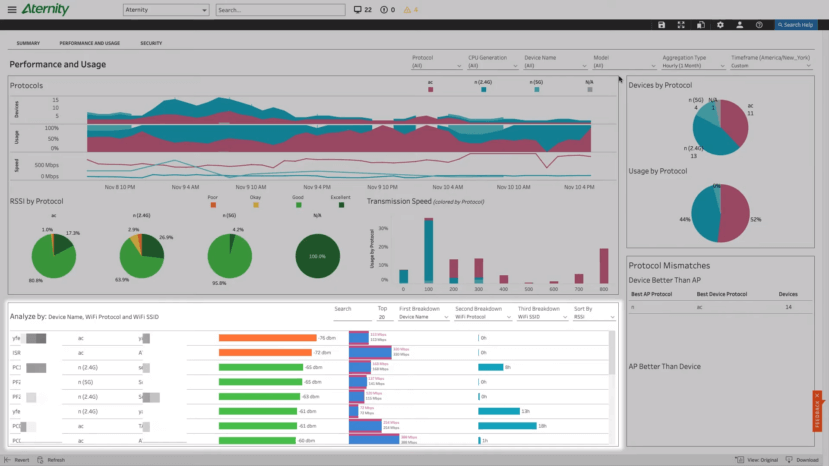
End-user side: which band is experiencing the best data rates (2.4G / 5.0G / AC)?
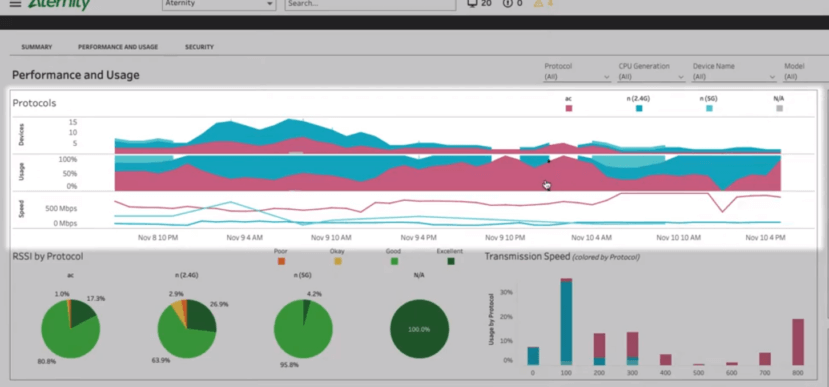
Below is a sample dashboard from Aternity. It clearly shows the throughput of all Wi-Fi bands utilized by users, put in charts stacked together for easy comparison.
End-user side: which clients prefer more advanced Wi-Fi bands?
Sometimes clients can connect to access points using newer protocols and Wi-Fi bands. Such cases are reported in below screen in the Wi-Fi dashboard.
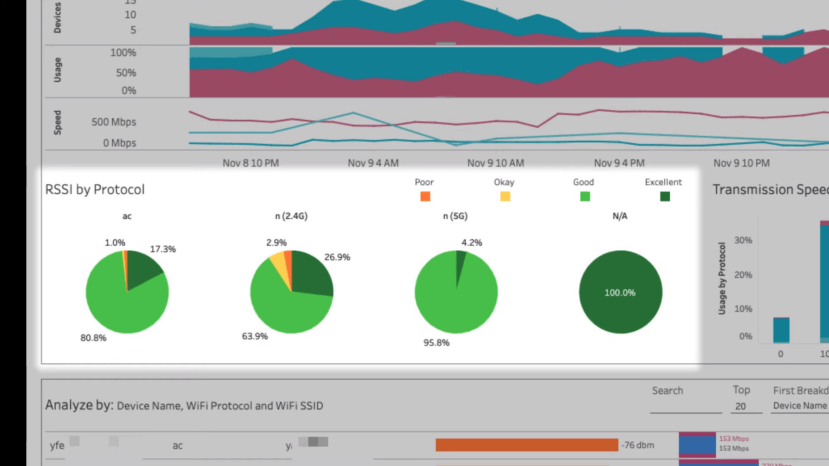
End-user side: which bands are experiencing worse RSSI (2.4G / 5.0G / AC)?
All-important RSSI, split by frequency band and signal quality (Poor/Okay/Good/Excellent) available in this section of the dashboard.
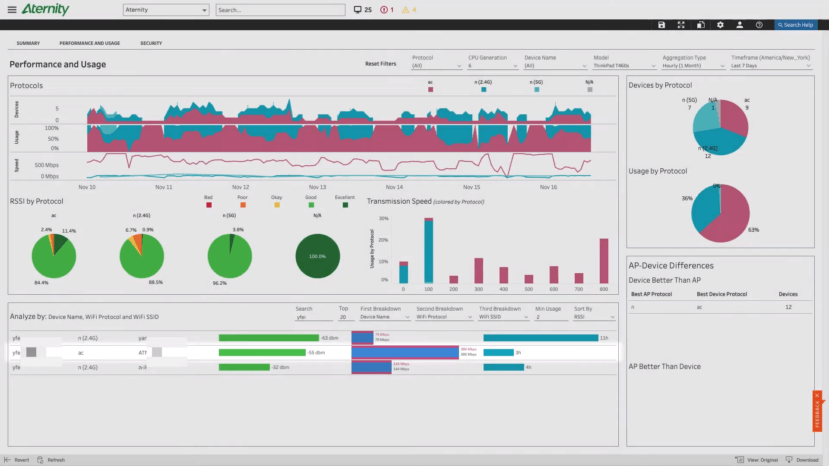
End-user side: what SSIDs experiencing the worst RSSI?
Who are the worst hit users affected by bad RSSI? What were their throughput speeds? Answers to such questions are easily available in this dashboard view.
End-user side: track usage characteristics of users’ Wi-Fi
Picking right metrics to view together for comparisons and contrast is the effective method for proper root cause analysis of problems. Therefore, we have a section of the Wi-Fi dashboard where we showcase the user’s experience for each band by RSSI and throughput.
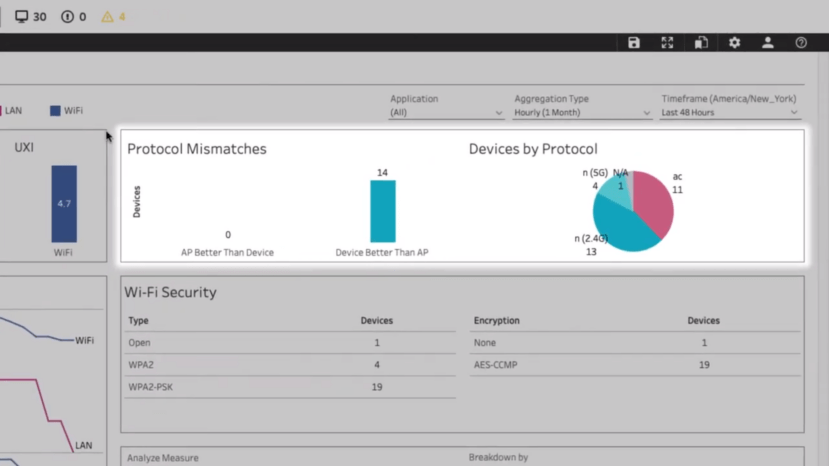
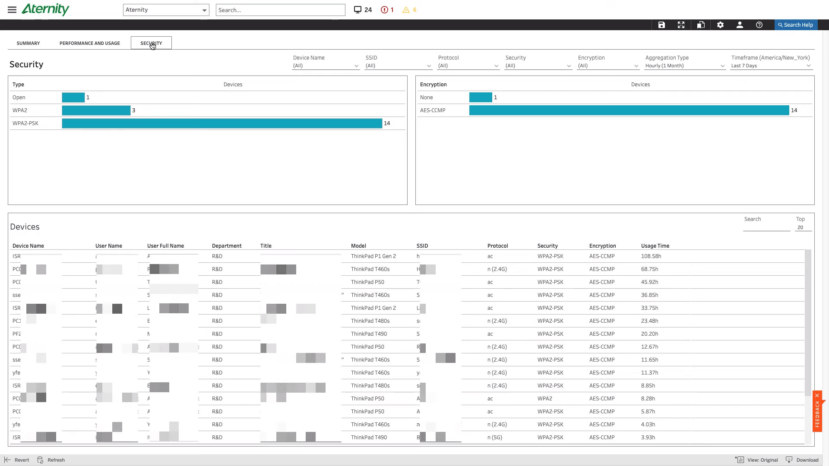
End-user side: Wi-Fi encryption used by user’s devices—determine whether they might be vulnerable to intrusion/attack.
A full view of the various encryption technologies used by user’s devices is a must. For that, the below dashboard will showcase the encryption technology used by your user’s Wi-Fi connections.
Conclusion
There is a wealth of data for Wi-Fi monitoring made available by Riverbed performance monitoring tools. On the infrastructure side with NetIM and the user’s side with Aternity. Above all, this provides businesses with complete visibility for Wi-Fi performance monitoring. So, make sure you have metrics and analytics and that you are prepared against Wi-Fi performance problems that confound most teams. Wi-Fi performance problems are expensive to bear and resolve.