Five Scary End User Services Metrics and How to Address Them with DEX
- By Riverbed Technology
- 26-May-2023
The pressure on end user services teams continues to grow. Hybrid work, the modernization of the digital workplace, and increasing demand for consumer-like experiences all combine to complicate the role of service desk and digital workplace services teams. IT leaders and staff in these teams must balance incident response with innovation, while supporting the transformation agendas of their organizations. And with economic uncertainty and fears of recession, they must do this while controlling costs and reducing unnecessary spending.
Identifying areas to improve service and cut costs requires understanding the targets. What does “good” look like? How does your organization compare to industry benchmarks? Where is the “low-hanging fruit?”–the areas within easy reach that can be made better with less effort and investment. Luckily, organizations can rely on data from analysts, industry, and Digital Employee Experience (DEX) management tools like Digital Experience can help them address these challenges.
This blog covers five key end user services metrics and the role that Aternity DEX plays in helping organizations improve them.
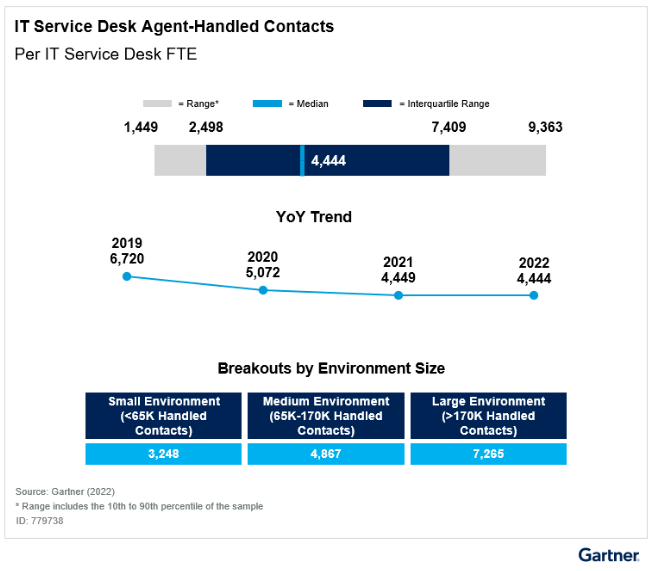
Metric 1: Number of contacts per service desk agent
The first data point comes from Gartner’s report, IT Key Metrics Data 2023: End-User Services Measures — IT Service Desk Analysis (subscription required). This research contains high-level Service Desk cost efficiency and staff productivity benchmarks based on data collected throughout 2022 from a global audience of CIOs and IT leaders. It shows that the average service desk agent handled 4,444 contacts per year in 2022, about the same as in 2022. Note the wide distribution in the data by size of the environment. That’s a lot of contacts! The data point out the intense nature of service desk work–especially with increasingly demanding end-users who expect a consumer-like experience for their corporate IT. The data also points out the importance of Riverbed IQ in enabling service desk staff to deal with large numbers of contacts.
How Aternity DEX helps improve Metric 1
The first goal of any service desk is to improve the quality of service delivered in order to reduce the volume of inquiries and issues. The second goal is to reduce the time required to resolve inquiries and issues through self-service and automation. Aternity comes with an extensive library of pre-built automation scripts that can be applied to a single user’s device or to a group of devices. Aternity automated remediation enables IT to automate the recovery actions necessary to resolve the most commonly expected end user issues. Watch this short video to see how Aternity automated remediation enables IT to proactively identify and resolve end user issues.
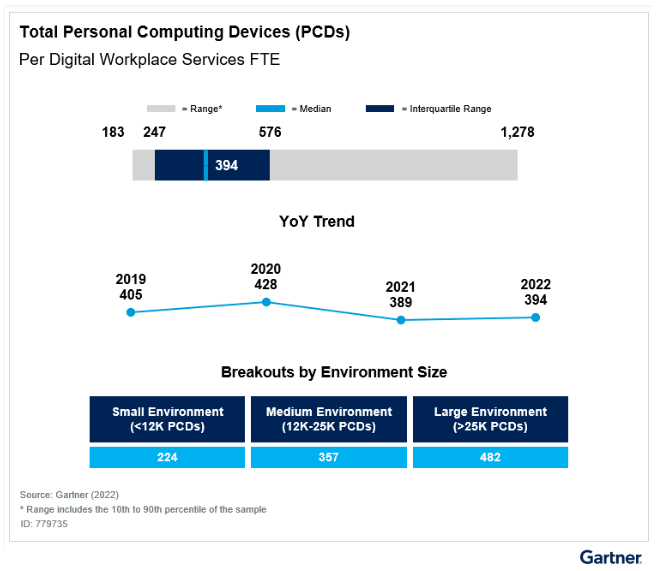
Metric 2: Number of devices per digital workplace services staff
The next data point comes from a different Gartner document based on the same 2022 survey. Like the research above, the report IT Key Metrics Data 2023: End-User Services Measures–Digital Workplace Services Analysis (subscription required) contains cost efficiency and staff productivity benchmarks, but this time focused on digital workplace teams. Survey data show that investment in digital workplace services is 8.8% of total IT spending. Similarly, digital workplace services Full Time Equivalents (FTEs) represent 8.4% of total IT FTEs, including contractors. That’s not a lot of staff. Especially when you consider that a digital workplace services staff member supports 394 end user devices on average. Again, that number varies widely based on the size of the organization. Digital workplace teams must support a wide range of devices–laptops, PCs, virtual devices, and company-provided tablets and smart devices. And with macOS devices now reaching 23% in the enterprise, these teams require tools that enable them to support a broad range of vendors.
How Aternity DEX helps improve Metric 2
Automated remediation certainly helps digital workplace teams manage larger numbers of devices per FTE. Aternity also integrates with ServiceNow Incident Management, so that digital workplace staff never have to leave ServiceNow to analyze Aternity device health and performance data or user information when resolving an issue. Not only can they see Aternity digital experience data right in the ServiceNow Incident Management interface, they can also execute Aternity automated remediation actions from there as well. This helps reduce resolution time, improving service, reducing costs, and enabling digital workplace services staff to support a larger environment. Watch this short video to see how it works:
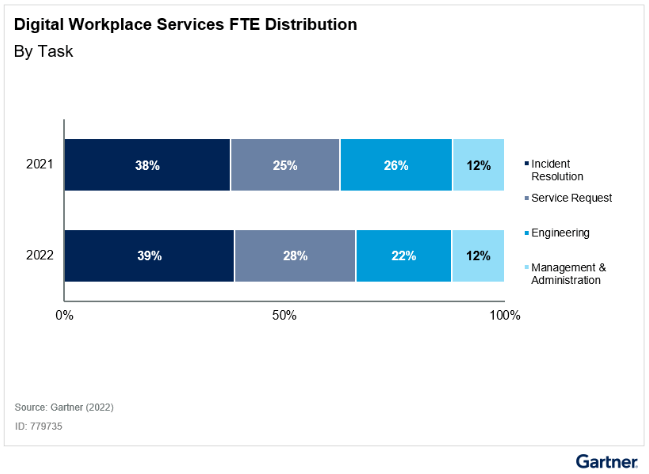
Metric 3: Task allocation for digital workplace services staff
A second datapoint from the digital workplace services report shows the breakdown of how these staff members spend their time. In 2022, digital workplace teams spent 67% of their time on incident resolution and service requests, up from 63% in 2021. The four percent increase came out of engineering time. The data clearly show that when staff members are overwhelmed with fire-fighting and responding to routine service requests, they have less time to devote to higher value innovation or digital transformation projects.
How Aternity DEX helps improve Metric 3
Aternity provides a variety of capabilities that enable digital workplace teams to quickly identify digital experience improvement areas that will have the biggest payoff. Aternity Experience Insights provide digital workplace services with a list of issues, sorted by impact to employee productivity, so they can identify which improvement projects should be tackled first. Here’s another short video to show how this works:
Riverbed Aternity Digital Experience Index (DXI) automatically identifies digital experience hot spots across your enterprise impacting employees and customers, then sets you on a path to action and improvement. You can establish goals for particular areas, based on industry benchmarks, and prioritize the importance of each area affecting digital experience. You can benchmark your own digital experience against your industry peers and compare the digital experience of different parts of your organization. Aternity DXI can serve as the foundation of your continuous improvement program for digital experience. Here’s how it works:
Metrics 4 & 5: Wasted SaaS licenses & prevalence of shadow IT
SaaS usage has skyrocketed in organizations of every type. That’s no surprise. In 2008, Gartner reported that worldwide SaaS revenue hit $6.4 billion. This year, SaaS spending is projected to reach $195 billion, up from $167 billion in 2022. And the Gartner End User Services report referenced above shows that in 2022, SaaS comprised 40% of digital workplace services software spending, up from 34% in 2021.
The Zylo 2023 SaaS Management Index Report provides more detail. According to Zylo, the average organization has 291 applications in their SaaS portfolio and spends $50M annually on SaaS. This equates to about $4600 per employee. While companies have committed to SaaS to run their business, Zylo reports significant waste. On average, organizations use only 56% of their SaaS licenses. The remaining 44% are wasted. Do the math. That’s an average of $22M in wasted software spending, every year.
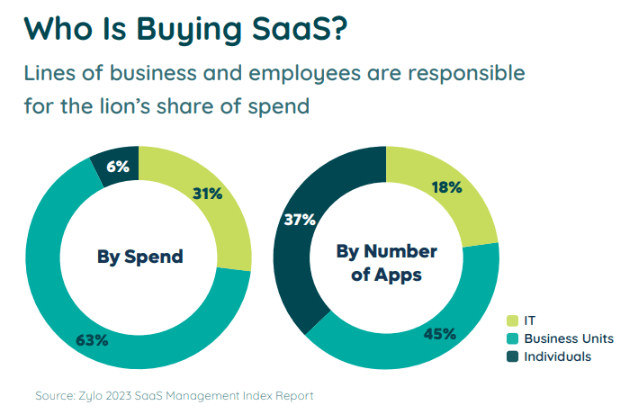
The Zylo 2023 SaaS Management Index goes further to identify who is buying these SaaS licenses. It’s not IT. IT purchases only 31% of SaaS by spend and 18% by number of applications. Shadow IT is a big issue. While only 6% of application spend is on shadow IT, the category accounts for 37% of total application quantity, according to the report.
How Aternity DEX helps improve Metrics 4 and 5
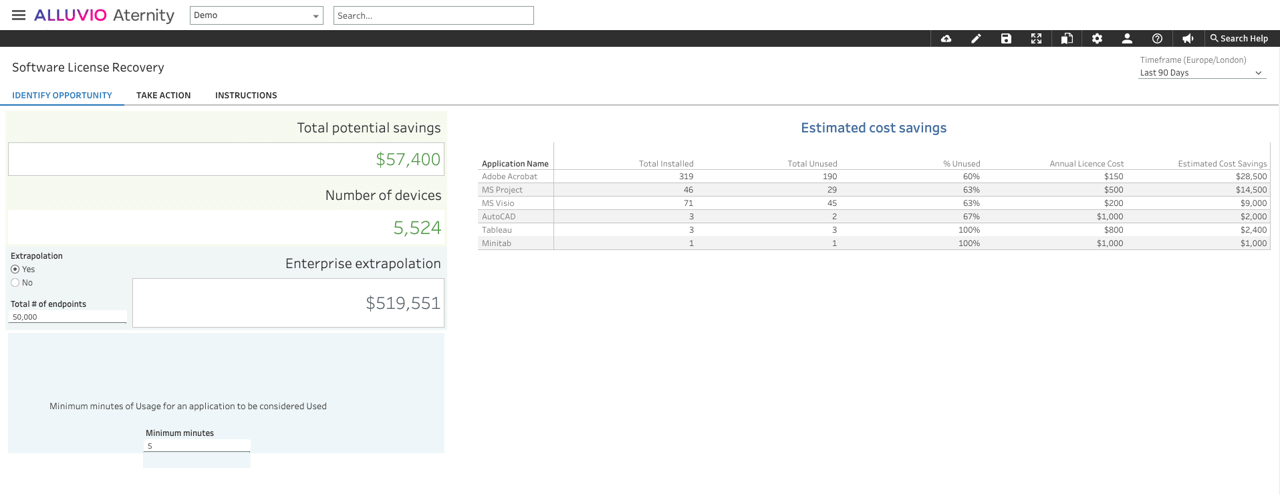
One of Aternity’s key capabilities is IT asset cost reduction. Aternity automatically discovers every application in use in the enterprise, no matter what type it is. Thick client, web, SaaS, even Shadow IT. Aternity enables you to track actual usage of every type of application in your enterprise, and save money by identifying the software licenses that are unused or under-used.
Get your end user services teams started with Aternity today
You can explore how Aternity enables you to address these key end user services metrics by registering for a Request Demo of Riverbed Aternity. Download our software to understand how our approach to DEX helps you reduce costs, improve productivity, and deliver better customer satisfaction.