When Outages Become Routine, Digital Experience Becomes Critical
What a week of disruption reveals about visibility, response, and recovery.

- By Colleen Marinelli
- 20-Nov-2026
Every outage has two stories: when the service came back, and when your employees did.
In just the past week, disruptions across critical cloud services have highlighted a growing challenge for IT teams: maintaining a reliable Digital Employee Experience (DEX) when the applications employees depend on become unavailable. The Microsoft 365 outage was one highly visible example, disrupting Outlook and other services organizations rely on every day.
For IT, the challenge is not simply knowing that a provider is experiencing a problem. It is understanding what that disruption means for the organization: who is affected, where the impact is concentrated, what is happening underneath the employee experience and whether people can reliably work again after service is restored.
As digital environments become more interconnected, those answers are harder to find. That is why independent digital experience visibility is becoming essential to operational resilience.
See Disruption from the Employee Point of View
During the Microsoft 365 disruption, Aternity telemetry gave IT a direct view of how the incident was affecting employees. The Outlook disconnect monitors were already configured and running, and when the outage began they surfaced a sudden spike in disconnect events as it happened, not after the help desk queue filled.
The geographic view showed scope at a glance. The larger the bubble, the more devices were experiencing Outlook disconnects, helping IT see which locations were hit hardest and direct attention there first instead of inferring impact from scattered user reports.
Before the outage, Outlook disconnect activity remained near its normal baseline, with limited geographic impact.
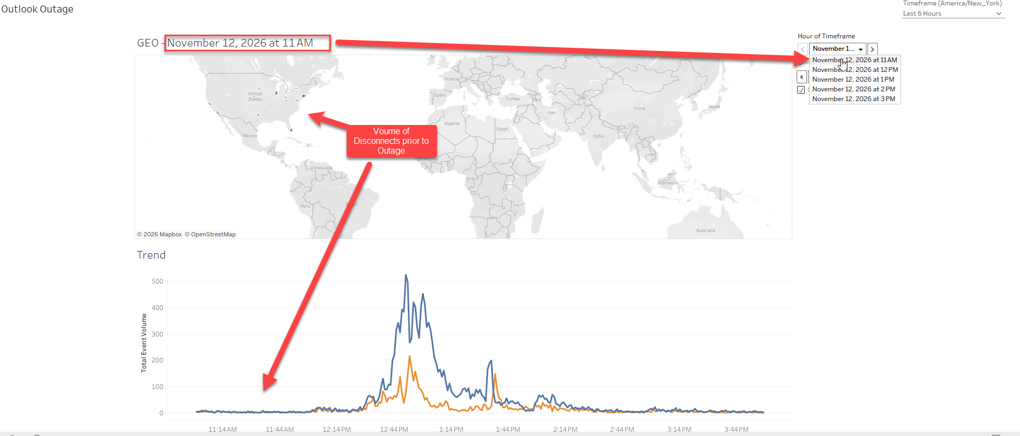
Aternity Outlook telemetry shows low disconnect volume before the Microsoft 365 disruption at 11:00 a.m. ET on November 12, 2026.
As the incident unfolded, disconnect activity rose sharply and the geographic view showed a much broader population of affected devices. Blue represents Outlook disconnects; orange represents reconnects.
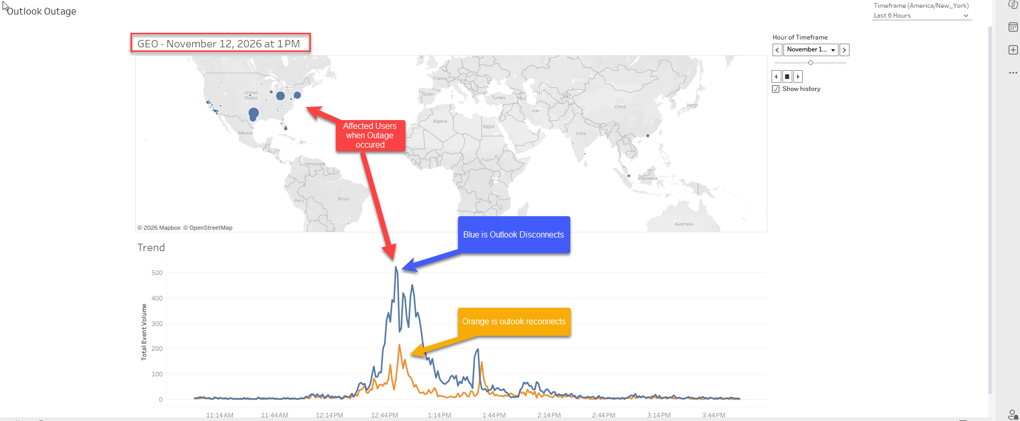
During the incident, Outlook disconnects rose sharply across affected locations, while reconnect activity provided an additional signal for following the changing employee experience.
Service Restored Does Not Mean Experience Restored
Detection is only part of the story. A provider can report that remediation is complete while employees continue to experience delayed workflows, application errors or downstream effects.
The status page can turn green before the employee experience does.
Recovery is not defined solely by a provider status page. It is defined by whether employees can once again reliably use the applications, collaboration services and workflows their jobs depend on.
Aternity data from the incident shows what that looks like in practice. Recovery did not arrive as a single moment. Reconnect activity began climbing in the early hours of November 13 and came in several waves through the morning as affected devices re-established their connections.
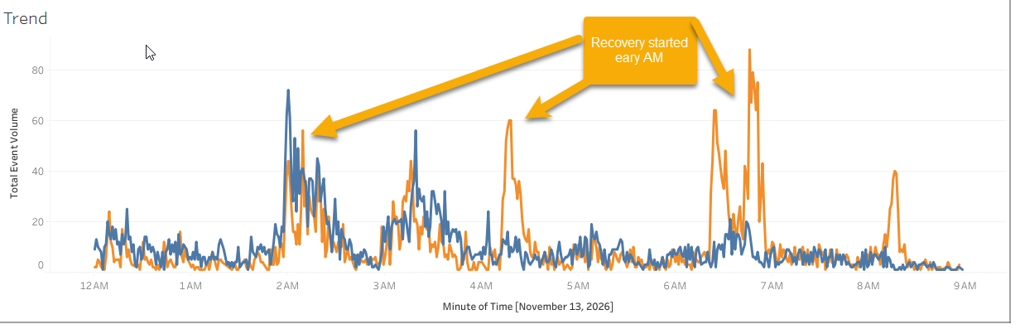
Outlook reconnect activity began rising in the early hours of November 13 and continued in waves through the morning, giving IT an independent way to track recovery as it unfolded.
See What was Happening Underneath the Experience
The employee-impact view was only one part of the story. In a separate product view, NPM+ telemetry from globally distributed agents provided another layer of evidence, revealing the underlying network and application conditions during the incident.
Five NPM+ key performance metrics break response time into the components that shape the end-user experience: connection setup time, request-data transfer time, server response time, response-data transfer time and retransmission delay. Together, those metrics showed performance degrading at approximately 11:00 a.m. ET on November 12 and returning toward its normal range at approximately 9:30 a.m. ET the following day.
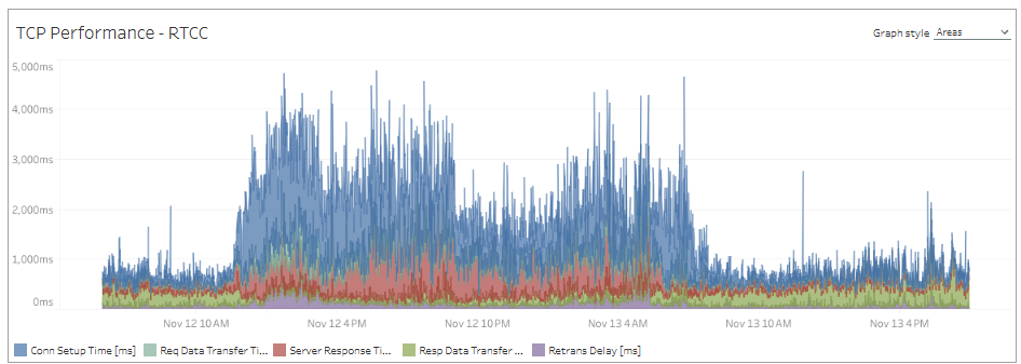
NPM+ breaks end-user response time into five performance components, revealing when degradation began and the underlying conditions contributing to the slowdown.
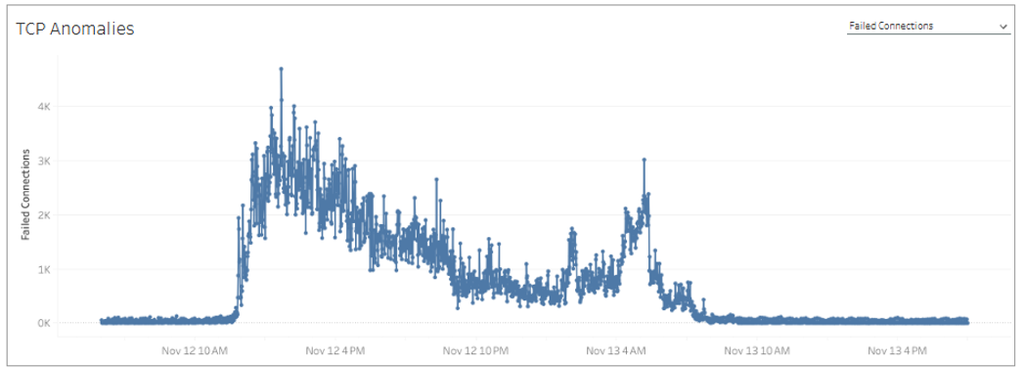
NPM+ shows failed connection attempts increasing sharply across globally distributed agents during the Microsoft 365 outage, then declining toward baseline as conditions recovered.
TCP retransmissions provided a third, reinforcing NPM+ signal. Retransmissions occur when packets are not successfully acknowledged and must be sent again. Across the globally distributed agents represented in the dashboard, retransmissions rose from a near-zero baseline to approximately 35% to 40% during the most severe periods, closely tracking the elevated response times and failed connections shown in the other metrics.
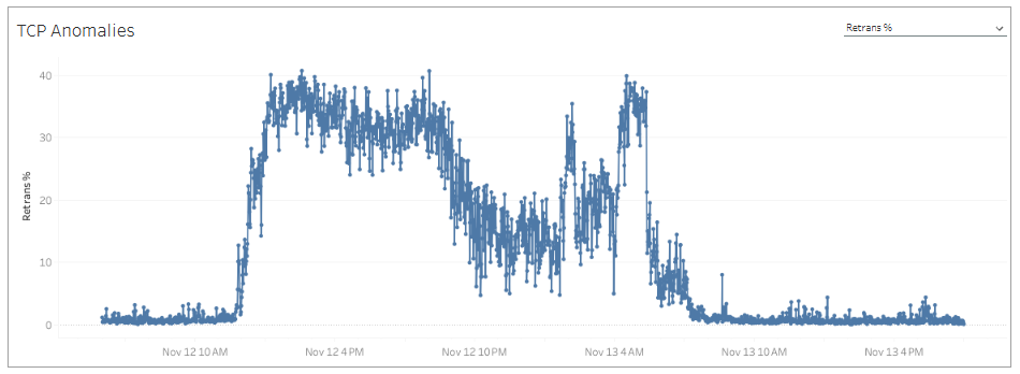
NPM+ shows TCP retransmissions rising to approximately 35% to 40% during the Microsoft 365 disruption, then returning toward baseline as conditions recovered.
No single metric tells the entire story. Aternity showed the direct impact on employees and where affected devices were located. NPM+ revealed the underlying changes in response time, connection failures and TCP retransmissions across a globally distributed device population.
Combined, the telemetry showed when the incident began, how it affected the digital experience and when conditions returned toward normal.
DEX Doesn’t End at the Endpoint
Today’s employee experience spans an interconnected technology ecosystem. Employees work on devices, connect through Wi-Fi and corporate networks, authenticate through identity services, use SaaS and cloud applications, and collaborate through services such as Microsoft Teams.
The Microsoft 365 outage illustrates why DEX cannot stop at endpoint health. Aternity showed how employees were experiencing the disruption, while NPM+ telemetry exposed the performance and network conditions underneath it.
Aternity 360° brings these perspectives together, connecting device, application, network and employee-experience intelligence so IT can understand what is happening, pinpoint likely causes and accelerate resolution. We believe this approach has been independently recognized across the DEX market, with Riverbed recognized as a Leader in DEX by Gartner, IDC and Forrester.
Turn Telemetry into Answers with Riverbed IQ and Q
Modern IT does not lack telemetry. The challenge is turning telemetry into understanding quickly enough to act.
During the Microsoft 365 incident, Riverbed’s own corporate IT support team used Riverbed Q, powered by the Riverbed IQ intelligence layer, to investigate the disruption across globally dispersed agents. IQ helped correlate the underlying telemetry, while Q provided a conversational way to investigate the evidence.
IQ pinpointed where the disruption was concentrated and surfaced what was driving the failure, giving the team a clear place to start. They went straight to the source of the problem, aligned faster and acted with confidence.
Without IQ, the team would have been piecing signals together by hand across a global agent population. With IQ, they had an evidence-backed answer to the question that matters most in an outage: where is the problem, and what do we do first?
Riverbed IQ turns Aternity’s rich experience telemetry into actionable intelligence, helping IT understand what changed, identify who is affected, pinpoint likely causes, prioritize response and move from insight to remediation. Riverbed Q gives teams a natural-language interface for investigating that evidence.
Insight is only useful if employees hear about it. With email down and Teams and SharePoint unreliable, the usual channels for communicating an outage were the ones affected. Riverbed IT used broadcast notifications, part of the Aternity Sentiment capabilities, to deliver a pop-up notification to employees’ devices in real time. It told them what was happening and, through an embedded link, pointed them to the official Microsoft service health page.
That closed the loop. IT could see the impact, investigate the cause and reach employees where they were working, without depending on the services that were down.
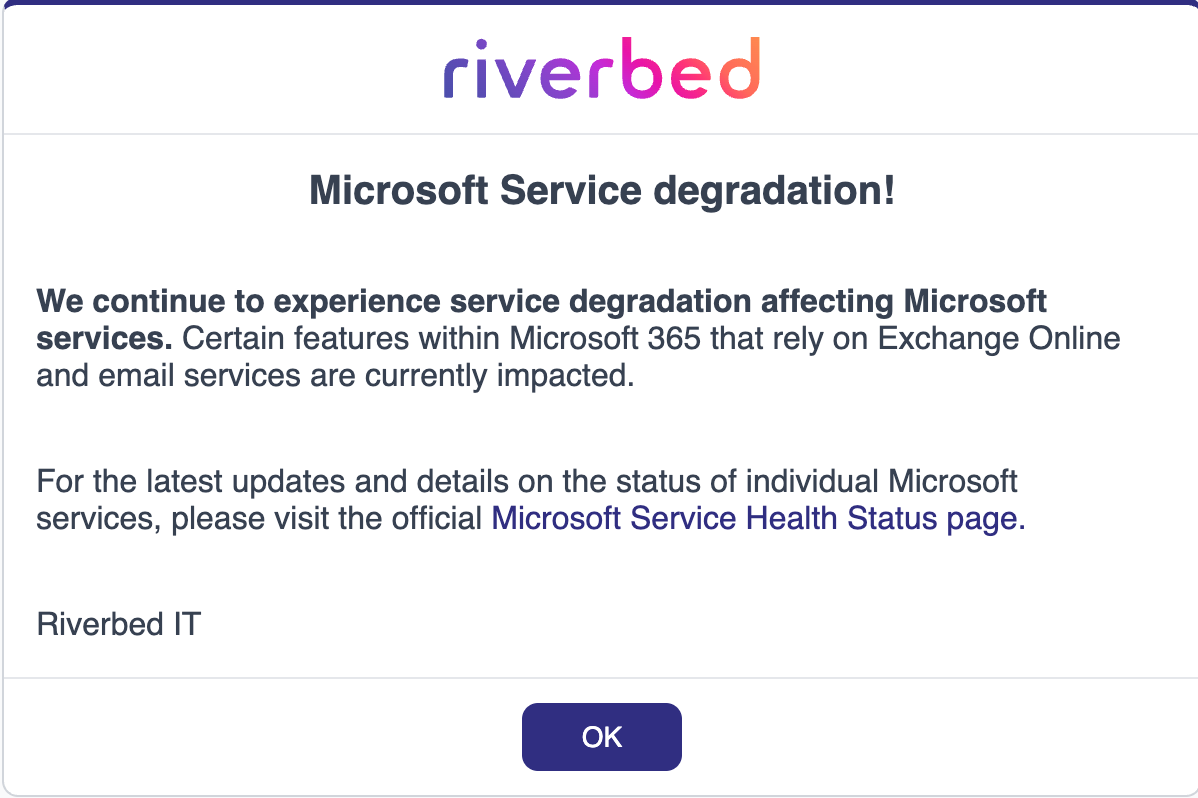
A Riverbed IT broadcast notification delivered to employees’ devices during the Microsoft 365 disruption, directing them to official service status updates while email and collaboration tools were unreliable.
Know When Your Business is Really Back
Operational resilience depends on more than knowing when a cloud service is available. It requires understanding the impact of disruption, pinpointing where problems persist and knowing when employees are productive again.
If this week’s disruptions remind us of anything, it is that the next outage is not the question. How quickly IT can understand and respond to its impact is.
Service availability tells you when the cloud is back. Digital experience tells you when your business is back.
Ready to See Beyond the Endpoint?
Download the Aternity 360° Design Blueprint to see how Aternity 360° connects device, application and network intelligence to help IT uncover root causes, accelerate resolution and minimize disruption.
