Real Time Customer Experience Visibility for Modern ATM Fleets
- By Ishan Kapoor
- 14-Apr-2023
Modern automatic tellers are packed with sophisticated hardware and software to enable an up-to-date user experience for customers. All this sophistication naturally brings with it some challenges for the banks and IT teams. In this blog, let’s discuss what those pitfalls are and how Riverbed’s Aternity Digital Experience Management platform can help with clearer customer experience observability.
Get 30k foot view of customer experience
If the telemetry coming back in from the ATM fleet in the form of logs, metrics or traces is still being analyzed in an ad-hoc manner, that is almost like taking a step back in time by at least a decade. Once affected by an incident, without a holistic observability, understanding the underlying root cause of degraded user experience is wrapped in a few assumptions and incoherent analytics or trends.
Compare that, for instance with a screen like below, summarizing the customer experience across the entire ATM fleet, out-of-the-box. To maximize the value of your screen real estate while providing dashboards with high level view of system wide health, Riverbed Aternity diligently distills various analytics and metrics from the entire ATM fleet into a handful of carefully curated numbers, like UXI Score. The UXI Score incorporates health indicators like Crashes, Hanging, and Wait Time.
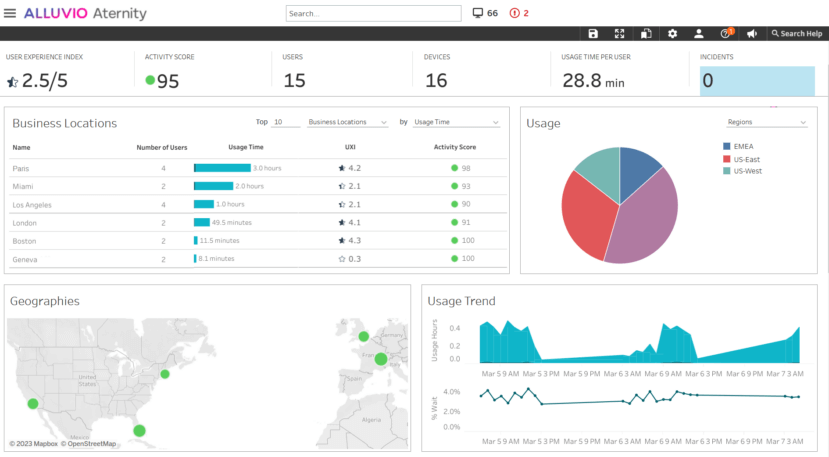
Riverbed Aternity also captures and provides the following categories of raw of ATM Observability metrics, which are further heuristically distilled into various cocktail metrics like UXI User Experience Index:
- ATM Performance and Stability
- Application Performance and Stability
- Customer Activity Performance
Ultimately, even the most well-provisioned ATM hardware and connectivity can leave gaps in customer experience. That is because modern applications running in production are themselves at mercy of layers of unpredictability. From bugs in the operating system to a manual configuration error in the networking components, the root causes of user performance degradation has many areas from which to sprout. It is therefore very important that measurements of the user experience is a first-class citizen in your observability tools and practices.
Below is an example of another real-time dashboard with a list of each activity performed by users overall. With each activity, we also showcase the breakdown of delays split by network component, server component and user component.
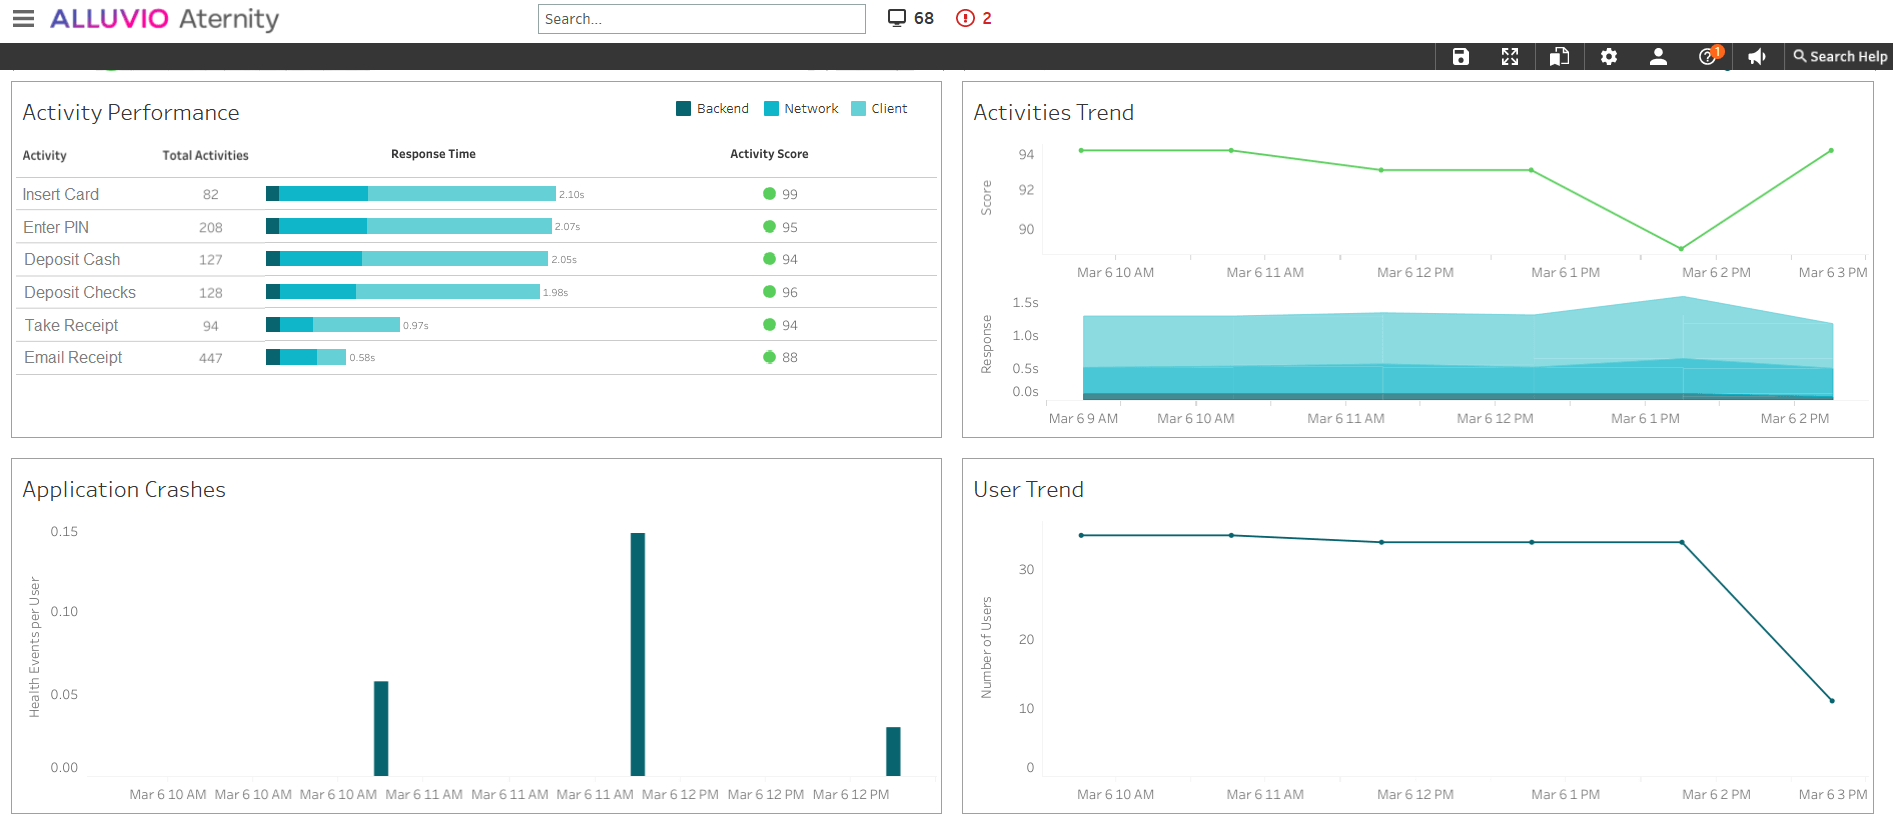
To get you the highest fidelity customer experience data points, Riverbed Aternity breaks down each customer’s transactions by activities. The following diagram clearly shows the relation between a customer’s transactions and what Aternity classifies as activities:

Diagnosing problems in the customer journey
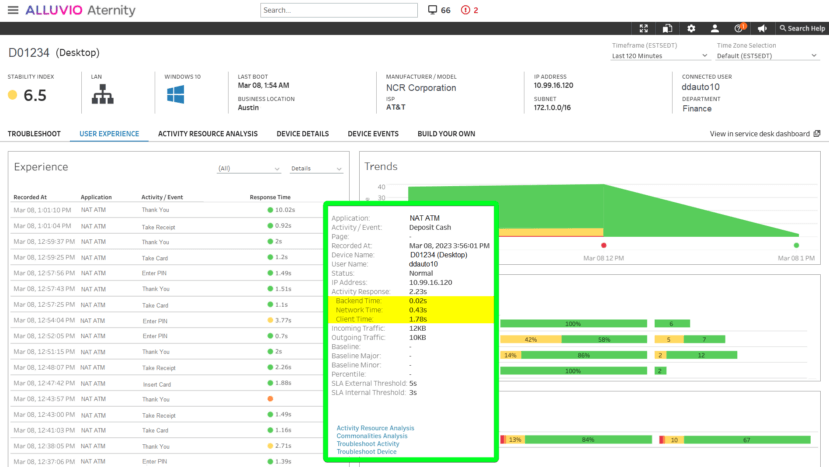
Observability with Riverbed Aternity includes monitoring so diagnosing problems with a poorly performing ATM and looking through each and every transaction performed on it is straightforward. And yes, as you hover over each activity a tool-tip pops up, as outlined in green below, in which each transaction showcases a split of response time by client time, network time and backend time.
Inspect all transactions for an ATM
We can even further deep-dive into individual transaction for a timeline-based view of the performance of transactions. In the image below, we focus on a single activity, Insert Card. It is clear that this transaction typically completes under 20 seconds, as indicated by the highlighted band close to the x-axis. However, there are various outliers, some of them showing exacerbated network time. Once such data-point is highlighted and a detailed tool-tip shows its full details:
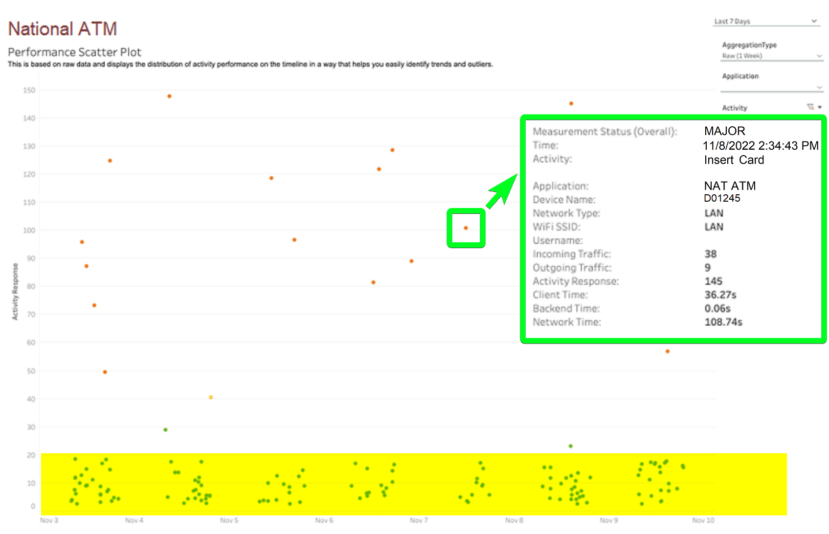
Identifying the frequency and trend of these outliers can help narrow down the conditions which cause such degraded experience—a more data driven approach to solving performance problems in your ATM fleet.
Analyze transaction performance
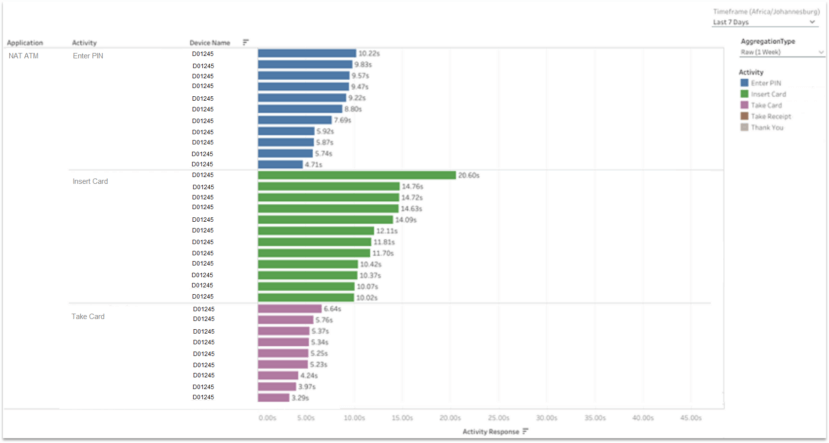
Which machines from the fleet are taking the longest to process this transaction? To answer such questions we can develop further customized dashboards like the one below where we list each activity that users perform sorted by the average time taken on that ATM. This identifies consistently poor performing ATMs where troubleshooting should be prioritized.
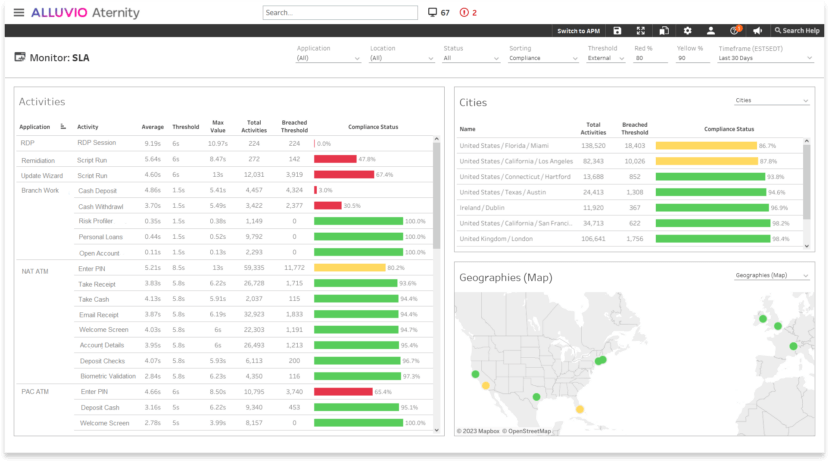
Analyze SLA compliance
In Riverbed Aternity, we can also set compliance SLA thresholds for ATM transactions and identify which cities and geographies which are consistently non-compliant with SLAs. The violating transactions are clearly listed along with their average, minimum and maximum values. We can then troubleshoot the poorly performing transactions in their geographies to understand how the customer experience can be improved, whether by improving network time or device or back-end performance.
Visit this page to learn why Riverbed Aternity is the right solution for your customer experience monitoring, whether it is at ATMs, web or desktop.